Is the New Normal just the Old Normal?
In a 2014 “A Wealth of Common Sense” post, Ben Carlson, CFA said “diversification is about accepting good enough, while missing out on great, but avoiding terrible.” If forced to summarize Q2, those would be my words of choice. I am not going to attempt an overly positive spin on what was a tough quarter, or on what remains among the most challenging socio-political investment environments that I have experienced in a nearly 30-year career. Objectively speaking, some of our investments performed greatly. Some performed terribly. On average, which is the point in the long run, our investments finished the quarter better than “good enough” on a relative basis. Of course, anyone that knows me also knows that “good enough” is not my normal, personal or professional, standard. Unfortunately, we are not in normal times. Or are we? Perhaps we have returned to normal times after enjoying years of abnormally high returns. Perhaps, even, we (meaning me) have been lulled into a sense of security, if not entitlement, by the post-financial crisis run. Regardless of our frame of mind, market performance for 2018 is far more typical than atypical. It is important that we adjust our expectations to align with 2018’s type of market in the near term, rather than anchoring our expectations on prior experience.
Q2 Review
During Q2, Trump’s escalation of trade tariffs moved from nascent threat to the forefront of investor concern. The tariffs enacted thus far have been China-oriented, micro-focused, and affecting sectors sufficiently small that they are estimated to have little (0.2% of U.S. GDP) macro effect on U.S. growth. Impacts upon employment and inflation are also expected, thus far, to be minimal. However, fear is growing that the opening salvos, rather than simply Trump’s unsettling negotiating style, could be just the tip of the spear that ultimately kills the global recovery.
China announced retaliation on a similar scale, about $50 billion (USD). Trump indicated that, if China does retaliate, he would ask the Office of the U.S. Trade Representative to expand tariffs to an additional $400 billion (USD) of imports, and separately threatened to impose additional tariffs on about $360 billion (USD) of automobile imports from both China and the European Union. Additionally, the U.S. is threatening investigations into China’s alleged misappropriation of intellectual property, and to block acquisitions in domestically sensitive industries. The latest actions raised investor fear of an all-out trade war between the world’s two largest economies, one likely to spread to the EU, Japan, Canada, and Mexico.
Investors fear the impact of escalating trade tension on global economic growth and the resulting hit to corporate earnings. The prospect of a protectionist driven slowdown follows what has been an extended period of rising economic optimism for the world. In January, the International Monetary Fund (IMF) upgraded its global growth forecasts for 2018 and 2019 by 0.2% to 3.9%. The most recent announcement from the IMF suggests that if the current trade threats are realized, and business confidence falls as a result, global output could be about 0.5% below that projection. Others have published opinions that a global trade war could result in a negative shock to global GDP of perhaps 1% to 3% in the next few years. That is not a 1%-3% reduction in the rate of growth, that is an actual reduction in the absolute level of global GDP. By comparison, the damage done by the great financial recession caused a drop in global GDP of about 5%.
Lake Jericho’s process of investing in domestic and global markets is fundamentally built upon stable, long-run, expected, global economic growth rates. Our investment horizon, except for client-specific or portfolio-specific exceptions, is similarly long-run (10+ years). Although we do make tactical adjustments within that long-run framework, we are not a “trading” type of company. It is better to think of the tactical moves made as a method to “nudge” portfolios in desired directions, rather than making reactionary, dramatic changes. There is minimal incentive in our process, within our long-run investment horizon, to react to short-term dislocations caused by threats to expectations of long-run, global economic growth rates. Yet in Q2, escalating trade fears did exactly that: undermine expectations in what has been an extended period of rising long-run, global economic growth rates. The result was a large divergence between domestic and international investment markets. During a quarter that saw meaningful underperformance in international markets, especially emerging markets, our significant positions in those markets overwhelmed positive U.S. market influences. By any technical definition, international markets, and particularly emerging markets, entered “correction” territory during Q2.
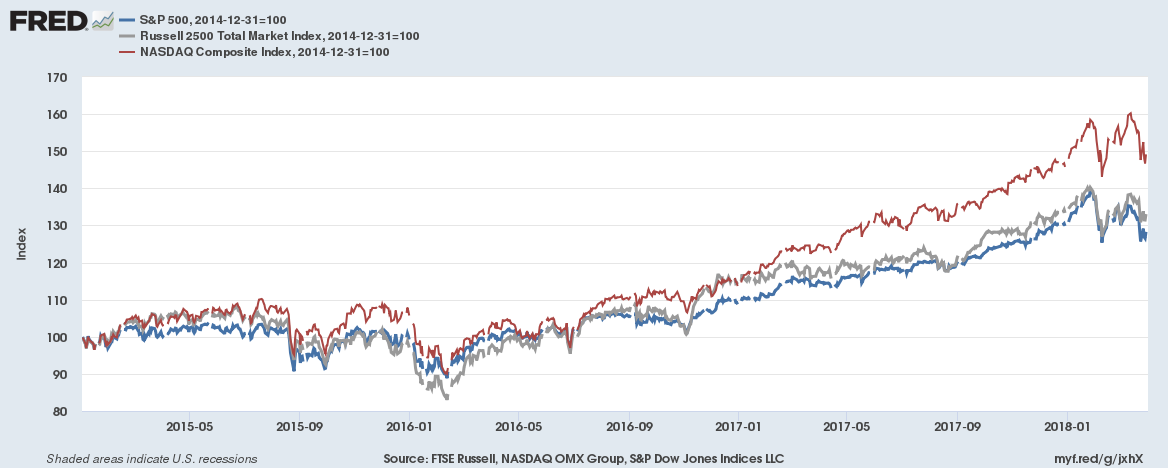
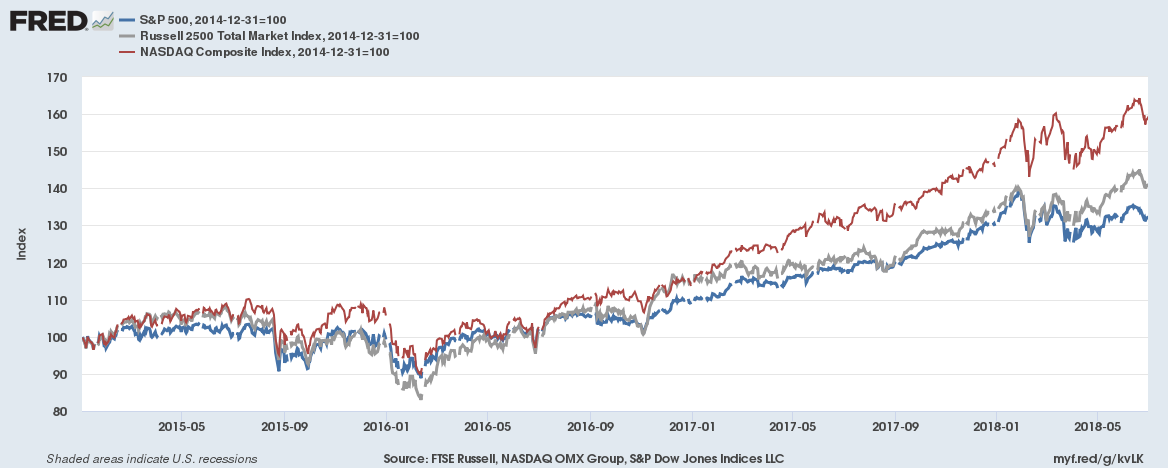
Despite rising trade fears, since topping out in late January, U.S. equity indexes have bounced about quite a lot, but have modestly advanced on a year-to-date basis. While at the end of Q2 the S&P 500® Index (a broad measure of large-sized U.S. companies) was down roughly 5% from late-January highs, the Index is once again positive for the year. Small- and mid-sized U.S. companies, represented by the Russell 2500™ Index, have fared significantly better, leading their large-company counterparts for most observation periods since inception of our Firm. The unchallenged leader amongst U.S. equity indexes continues to be the technology and consumer-cyclical heavy NASDAQ Composite Index.
Chart 1: U.S. Equity Returns Since Firm Inception
Small beats big, but the NASDAQ continues to lead.
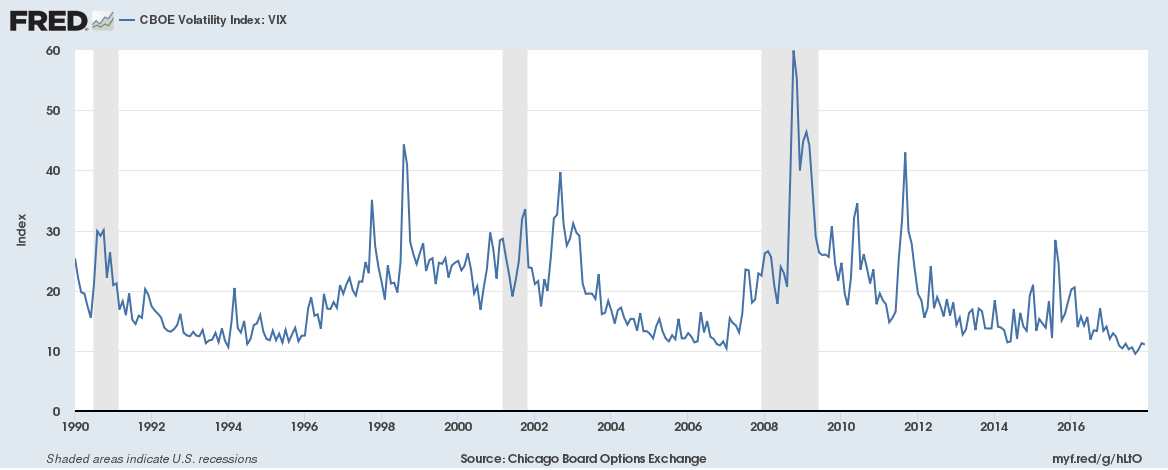
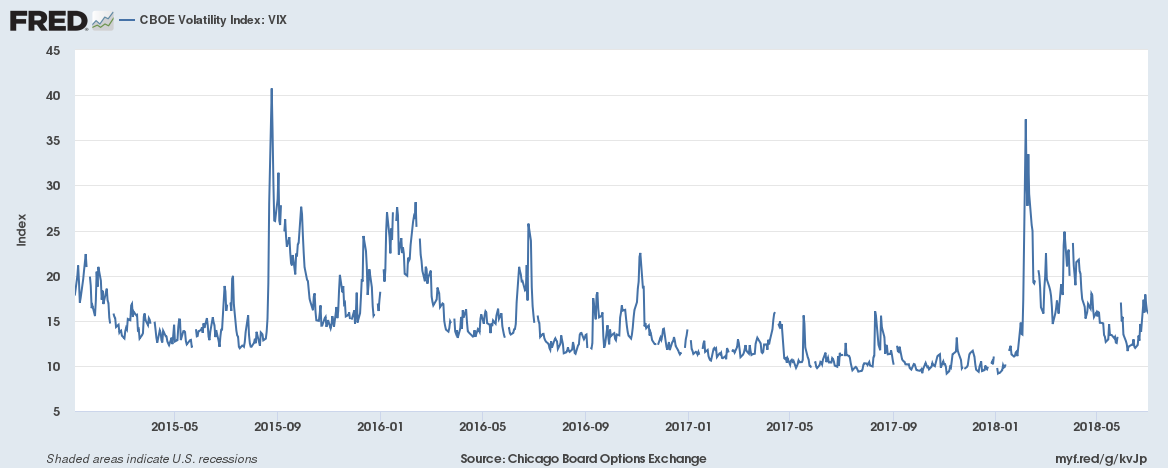
During 2017, the Chicago Board Options Exchange (CBOE) Volatility Index (VIX) index, a common measure of stock market volatility, averaged just 11.1%, the lowest annual average on record. Volatility has increased during 2018. The VIX is running at a 16.3% average for the year. Higher? Yes. But merely more in-line with the long-run average of 18.5%.
Chart 2: CBOE Volatility Index
Volatility representing more historically average risk.
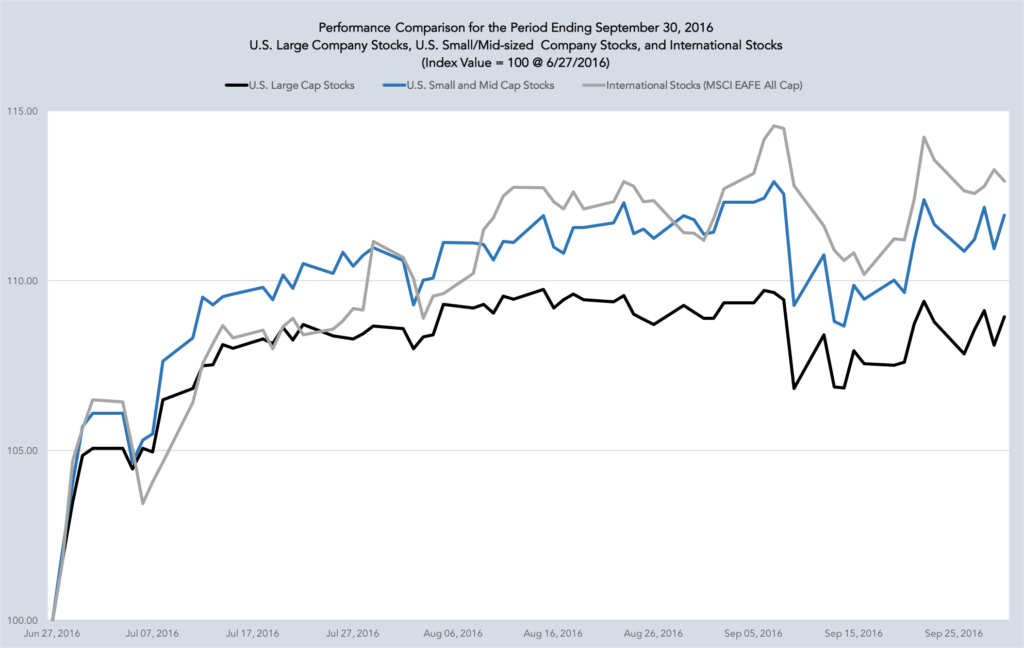
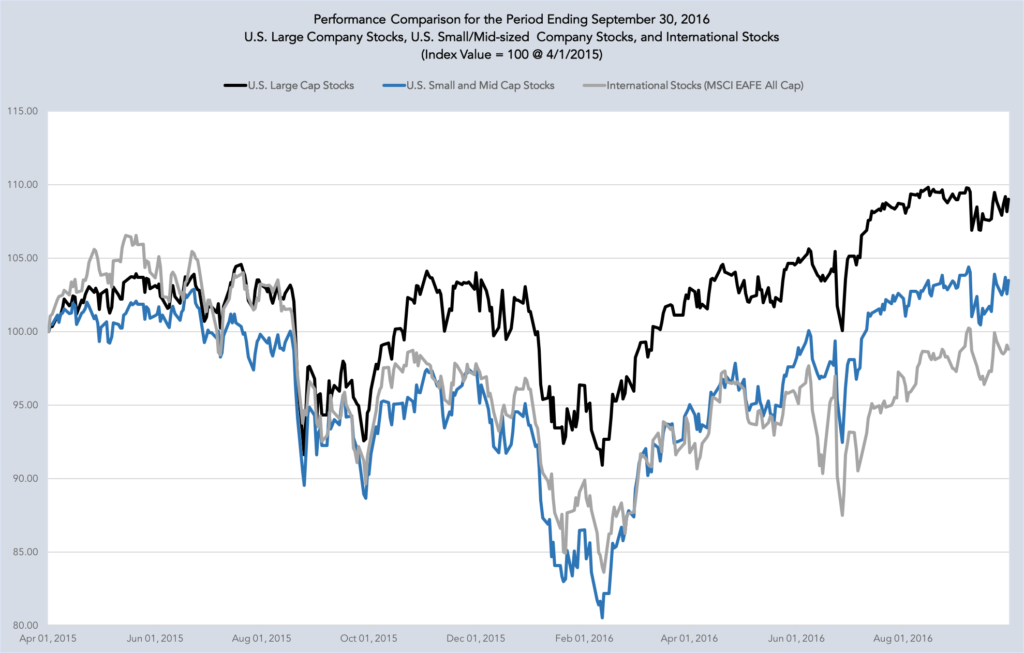
Turning to international markets and bonds, what 2017 gave us, 2018 is whittling away. For the U.S., exports account for a relatively small percentage of GDP. There are some sectors that are more reliant on trade than others, but for the most part, the U.S. economy is not heavily dependent on exports. Other countries, however, are heavily dependent on exports. It is that heavy dependence upon international trade that has so rattled international markets, and particularly emerging markets. The strengthening U.S. dollar is further exacerbating the problem, turning otherwise strong home-currency returns into negative returns once converted into U.S. dollars. With international allocations in our typical client portfolio running as high as 30%, even the small amount of 2017’s strong returns given back thus far in 2018 are having a meaningful impact.
Chart 3: Asset Class Returns
Following 2017’s significant lead, international markets trail significantly.
 Source: novelinvestor.com
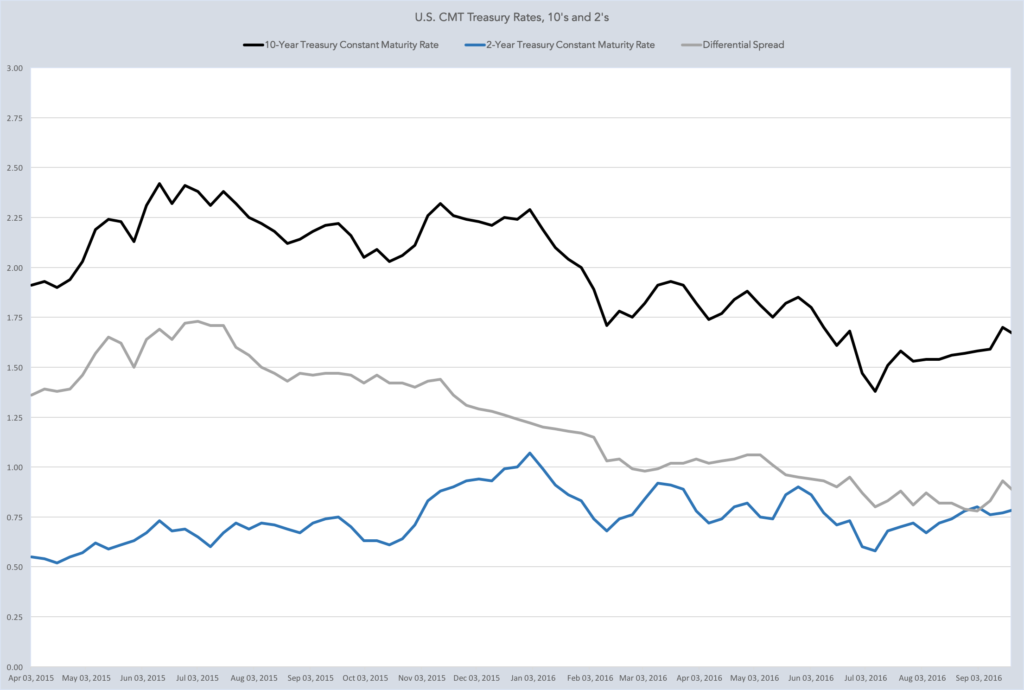
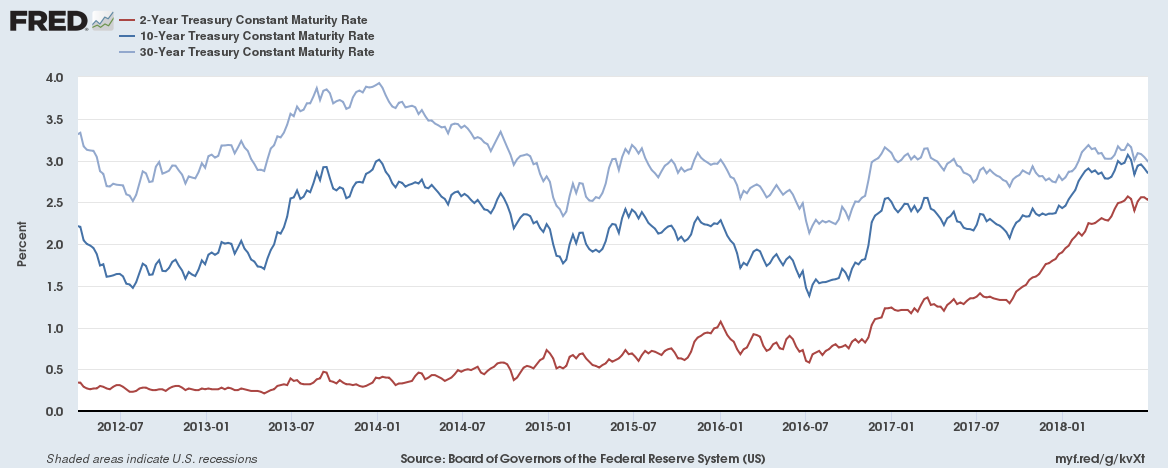
Bond funds gave us negative returns for the second consecutive quarter. The Federal Reserve raised interest rates another 0.25% during its June policy meeting, increasing the federal funds rate to a range between 1.75% to 2.00%. This was the second rate hike during 2018, and the seventh since the Fed started moving toward a more restrictive monetary policy in December, 2015. Consensus is that the Fed will raise rates two more times this year, and three times in 2019. The difference between U.S. short- and long-term bond yields narrowed to the lowest level since 2007. Of particular concern to investors is that short-term rates continue to rise while long-term rates remain stable. Market participants are holding down long-term interest rates, another indication of the potential threat to U.S. growth from the increasing threat of trade protectionism. A flat yield curve has traditionally been viewed by markets as a signal of a weaker economic outlook, while an inverted curve, where long-term bonds yield less than short-term bonds, is considered a harbinger of recession. We are not prepared to make that leap, but we are watching the relationship closely.
Chart 4: U.S. Treasury Yields
Interest rates are moving steadily higher, particularly short-term rates.
Summarizing the various market forces during the quarter:
- The S&P 500® Index finished Q2 with a total return of 3.43%, for a 2018 year-to-date return of 2.65%.
- The more concentrated, and more interest-rate sensitive, Dow Jones Industrial Average finished Q2 with a total return of 1.26%. For the first half of 2018 the return was -0.73%.
- The bright spot in the U.S. during Q2 was the technology and consumer-cyclical heavy NASDAQ Composite Index with a total return of 6.61%. For the first half of 2018 the return was 9.37%.
- Small- and mid-sized U.S. companies, as measured by the Russell 2500™ Index, outperformed large-company counterparts during Q2 with a total return of 5.71%, and a year-to-date return of 5.46%. Small- and mid-sized U.S. companies are less affected by the increasing threat of tariffs and trade-wars as less of their earnings depend upon overseas transactions. For Q2, the Russell 2500™ Index returned 5.71%, besting the S&P 500® Index return by 2.82%.
- International, developed markets portfolios as measured by the MSCI World (ex US) Investable Market Index finished Q2 with a total return of -0.77%, for a year-to-date return of -2.57%. Emerging markets as measured by the MSCI Emerging Markets Investable Market Index, after being a bright spot during Q1, finished Q2 with a loss of -8.02%, leaving the index with a year-to-date return of -6.86%.
- Bond markets, in the face of rising global interest rates, provided little shelter for investors. Interest rates and bond prices are inversely related, so as interest rates increase, bond prices fall. The Bloomberg Barclays U.S. Aggregate Bond Index finished Q2 with a total return of -0.16% leaving the year-to-date return at -1.62%. The Bloomberg Barclays US Aggregate Bond Index is a broad-based benchmark that includes U.S. Treasuries, government-related, and corporate securities.
- For context within broadly balanced portfolios, as most Lake Jericho client portfolios are some balanced average vehicles managed to the above indexes, the Morningstar, Inc. Moderate Target Risk Allocation category total return during Q2 was 0.56%, for a year-to-date return of -0.31%. Morningstar, Inc.’s Aggressive Target Risk Allocation category total return during Q2 was 1.14%, for a year-to-date return of 0.46%. Novel Investor’s (novelinvestor.com) Asset Allocation Portfolio detailed in Chart 3resulted in a year-to-date loss of -0.40%.
Getting to the specific decisions that influence Lake Jericho client portfolios, I will briefly cover the quarterly results of each of the five levels of our portfolio construction process. As a reminder, no client portfolio will match perfectly target portfolio allocations, sector allocations, or percentages in each, as every client portfolio is unique. Unique factors (portfolio start dates, timing of asset transfers, timing of individual contributions or distributions, overall risk profile, etc.) impact strategic and tactical decisions and the performance attribution of each. However, what follows will generally inform you of the influences upon your portfolio. Clients should carefully review their individual portfolio information to understand how their portfolio is impacted.
International versus U.S. (↓ Contribution)
For Q2, international equity versus U.S. equity strategy decisions versus an all-equity, U.S. market-neutral portfolio detracted from performance for the typical Lake Jericho client by about 2.11%.
Our overweights to international investments, particularly small-company developed market and emerging markets served as a meaningful contributor to client portfolio performance during 2017 and during Q1, 2018. With the view that foreign equities remained undervalued, trading at discounted valuations versus U.S. equities, we continued to increase portfolio exposures throughout 2018. That decision proved to be a bit premature given the impacts of rising trade worries. However, international markets continue trade at an average of 13.6X forward earnings, versus U.S. equities currently trading at an average of 17.1X forward earnings. It remains difficult to deny the value represented by international markets.
Bonds versus Stocks (↓ Contribution)
For Q2, bonds versus stocks strategy decisions versus an all-equity, U.S. market-neutral portfolio detracted from performance for the typical Lake Jericho client by about 0.10%.
Interest rates are on the move higher. As long as the move is reasonably paced then that move over time can be deftly managed. Lake Jericho managed portfolios are defensively positioned against the impact of rising interest, in terms of lower allocations to bonds than is considered typical, in how we constrain allocations to equity investments with high negative correlation with interest rates (real estate, utilities, consumer staples, heavily leveraged sectors), and in how we position the bond investments that we do hold. We believe that this defensive position is best in the current environment as yields provide little protection from sudden and large adverse price movements should rates move quickly higher.
Small Versus Big (↑ Contribution)
For Q2, small- and mid-sized company strategy decisions versus an all-equity, U.S. market-neutral portfolio contributed about 0.24% of additional performance to the typical Lake Jericho client.
One of Lake Jericho’s fundamental portfolio convictions is that investors should maintain an exposure to, if not an ongoing overweight towards, small- and mid-sized company equity investments across time. While on average, over the long-run, the space can provide superior investment returns versus large-company peers, much of the excess performance can occur in short, unexpected time periods. We are not in the business of predicting these patterns or trading these patterns, rather we hold as efficient of an exposure to this space as possible over time. This pattern of return, and our persistent holdings, can result in extended periods of underperformance. Our approach to manage this trade off is to employ across time three different strategies, simultaneously, that best expose portfolios to persistent factors of return within the space. This strategy works well across time.
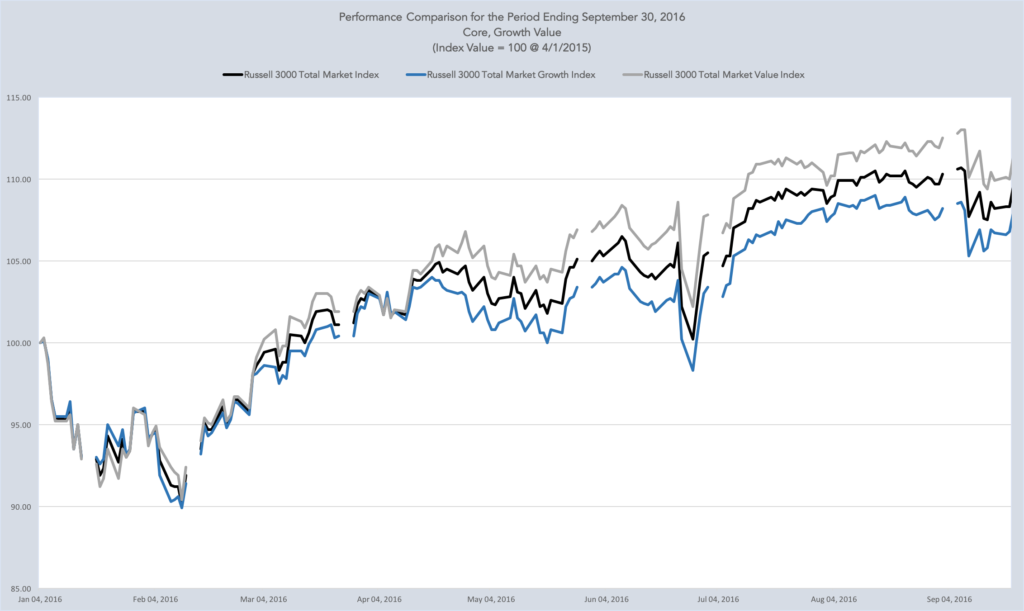
Value versus Growth (↓ Contribution)
For Q2, value versus growth strategy decisions versus an all-equity, U.S. market-neutral portfolio detracted from performance for the typical Lake Jericho client by about 0.84%.
As with small- and mid-sized company exposure, Lake Jericho managed portfolios maintain a constant bias towards value-oriented investments. The basic premise of value investing is that certain securities are underpriced bargains and are likely to outperform once their “real value” is fully appreciated by investors. “Value plays” can also be implemented for defensive positioning in certain sectors and markets. If for no other reason, it is a bit of common sense supported by the statistics that if you remain mindful of not overpaying for your investments then you are more likely to achieve superior returns over the long-run. Value-oriented investing is one method that helps investors achieve this objective. A gross over-simplification of an entire field of financial study, but that is the basic idea.
Like our decisions in the small versus big category, performance patterns in the value versus growth category demonstrate “clumpy” patterns of return. While on average, over long-run periods value-oriented strategies provide superior investment returns versus growth-company peers, extended periods of meaningful underperformance can persist. We are currently in an extended period of meaningful underperformance. But leadership does turn, and the relationship normalizes over time. Patience is the watchword here, and we remain patient.
To fairly represent value versus growth factors in the markets we use Morningstar, Inc. measurements. During Q2, the U.S. Value Index trailed the Total U.S. Market Index by 2.38%. The rolling one-year difference in total return advantage of the Total U.S. Market Index over the U.S. Value Index has been 5.46%. That difference is among the greatest spreads in value underperformance in such a compact time frame in measurement history. That degree of performance differential, though rare, certainly feels painful in the short-run. Our strategy and implementation in the space has suffered more so than the Index, but we look at the current valuation differences as an opportunity for future outperformance more than just as a negative for recent performance. All one need do is look back to 2016, a period in which the spread of value over growth extended to 17.63%, to understand how these patterns can reverse in meaningful ways.
Sector Overweight/Underweight Decisions (↑ Contribution)
For Q2, sector overweight/underweight strategy decisions versus an all-equity, U.S. market neutral portfolio contributed about 0.17% of additional performance to the typical Lake Jericho client, and has contributed about 0.39% of additional performance for the year-to-date.
Strategic and tactical sector weighting, the fifth aspect of our portfolio construction process, is an important part of how we add real, long-term value for our clients. Our process of underweighting U.S. equity market-neutral benchmark allocations in favor of overweighting those sectors that we expect to outperform the market average has been a meaningful tailwind for client portfolios over time. Our sector overweights are currently materials, financials via regional banks exposure, and healthcare via medical devices and technology. We are in the early stages of adding to our technology sector holdings due to upcoming changes in sector classifications, and the resulting impact upon sector valuations. We will comment more on that in coming quarters.
- While the materials sector has had a rough 2018 due to global macro concerns (finishing down by 3.01%) it had been a strong performer for the last couple of years. We erred when double-guessing ourselves on a standard sell-signal during 2017, believing that we should continue to hold the positions due to our continued outlook for global economic expansion and what we expect to be resulting commodity price inflation. Post Q1-end, materials was among the market leaders in terms of recovery for just those reasons. However, now with trade concerns continuing to suppress global growth expectations, and the U.S. dollar strength continuing to burden commodities and their emerging markets producers, it is possible that we could reverse course on this position sooner rather than later.
- While the financial sector generally struggled during Q,2 finishing down by 3.16%, our overweight is specific to the smaller regional banks. Regional banks added 1.39% in return during Q2, for a year-to-date contribution to return of 4.38% and besting the S&P 500® Index by 1.73%. We believe that regional banks in the U.S. are best positioned to benefit from a combination of lighter regulation, and higher loan growth rates loan particularly in the energy field as U.S. capacity once again ramps up in response to rising crude prices.
- The healthcare sector was a reasonably strong performer during Q2 with a positive return of 3.06%. But our overweight is specific to the Medical Device and Technology industry sector which provided a 8.51% in total return during Q2, for a year-to-date return of 15.72%
By necessity, when we apply sector overweights in the U.S. to industries such as materials, regional banks, and medical technology we are as well imbedding underweights to those sectors that we believe will perform poorly in the near term: real estate, utilities, and similar sectors that struggle under inflation and rising interest rates.
Near Term Outlook
As economic and financial professionals, we have it drilled into our collective conscious that trade wars are always damaging. As a student of economic history, I am keenly aware that even seemingly innocuous tit-for-tat trade spats serve only political theater and base mobilization. History shows us that trade conflicts, of any type, are rarely good for workers, consumers. or investors. Not in the long run. Negotiation tactics aside, my default reaction is dismissive disbelief that any rational person would support or enact protectionist trade policy, outside of bonafide national security interests, as an actual economic plan. As a free-market purist, my worldview is heavily informed by lessons learned across time, economy, and market. From the macroeconomic: the Smoot-Hawley Tariff Act of 1930, under which retaliatory reactions deepened and extended our own Great Depression. From the microeconomic: Bush, Jr.’s 2002 short-lived experiment with steel tariffs resulting in domestic job-losses numbering by some estimates of 200,000 in a single industry.
Nonetheless, we are continuing with our long-run, global economic growth estimates for both U.S. and international markets. Our targets remain, for now, the same as those we have held for the past two years (higher growth rate expectations for both foreign developed and emerging markets than for the U.S. market). As such, we will maintain our current allocations to international investments and our value bias. But in a slight attitudinal shift, we do so now more because of the recent period of significant underperformance. For historical relationships to remain intact, either international markets are significantly oversold, or the U.S. market is now overvalued. The same must be assumed of the value factor: it is now dramatically oversold, or growth oriented strategies are dramatically overvalued. We believe, in both cases, that it is the former, rather than the latter. We expect the relationships to normalize, which should lead to a period of significant outperformance at some point. But for the near term, as trade negotiations remain in the forefront of investor minds, we expect continued volatility in both domestic and international markets. We are not alone. Trade worries are giving investors, both individuals and institutions, reason to pause. Like most investors, we have a wait-and-see attitude until we can better determine what might be next in the Trump agenda.
We remain watchful and ready to respond should we see signs on the horizon sufficiently impactful to change our near term outlook. As always, I am available at any time, any day of the week, to discuss specific portfolio performance questions. Until then, be well, enjoy the rest of your week, and thank you!
A.J. Walker, CFA CFP® CIMA®
Founder, President, and CEO
Lake Jericho, LLC