1st Quarter 2018: Quarterly Recap and Near-term Outlook

Jockeying for Position Before the Final Turn.

Less than two weeks until the call to post for the 144th running of the Kentucky Derby! If ever a time existed to use thoroughbred racing analogies for investment markets, that time is now. If you are betting with the financial media pundits, then your money is on the race having made the final turn, that this market is thundering down the final stretch. But are we really down to the wire? I do not believe we are. The measures by which Lake Jericho evaluates long-term strategic decisions indicate that while the track is currently muddied, the fundamentals have not changed in a material way. Markets have merely returned to normal levels of volatility, fundamental factors such as global economic growth remain positive, corporate earnings are strong and rising, and after a 10.0% February correction stock prices became more reasonable than before. Our view is that global economies, markets, and investors still have the wind at their back. The market has not yet made the final turn, so we have more distance yet to run.

Q1 Review

2018 picked up as 2017 left off: low volatility and rising stock prices. During 2017, the Chicago Board Options Exchange (CBOE) Volatility Index (VIX) index, a common measure of stock market volatility, averaged just 11.1%, the lowest annual average on record. For context, the 10-year rolling VIX average is about 18.0% meaning that 2017 demonstrated nearly 40.0% lower volatility than the average post-financial crisis experience. During 2017, the S&P 500® Index (a broad measure of large-sized U.S. companies) posted significant gains every quarter to produce a total annual return of 21.8%. During January, the S&P 500® increased 5.73%, the biggest gain for a January since 1997. January’s close saw markets set another milestone: more than 400 trading days without a drawdown of 5.0% or more.

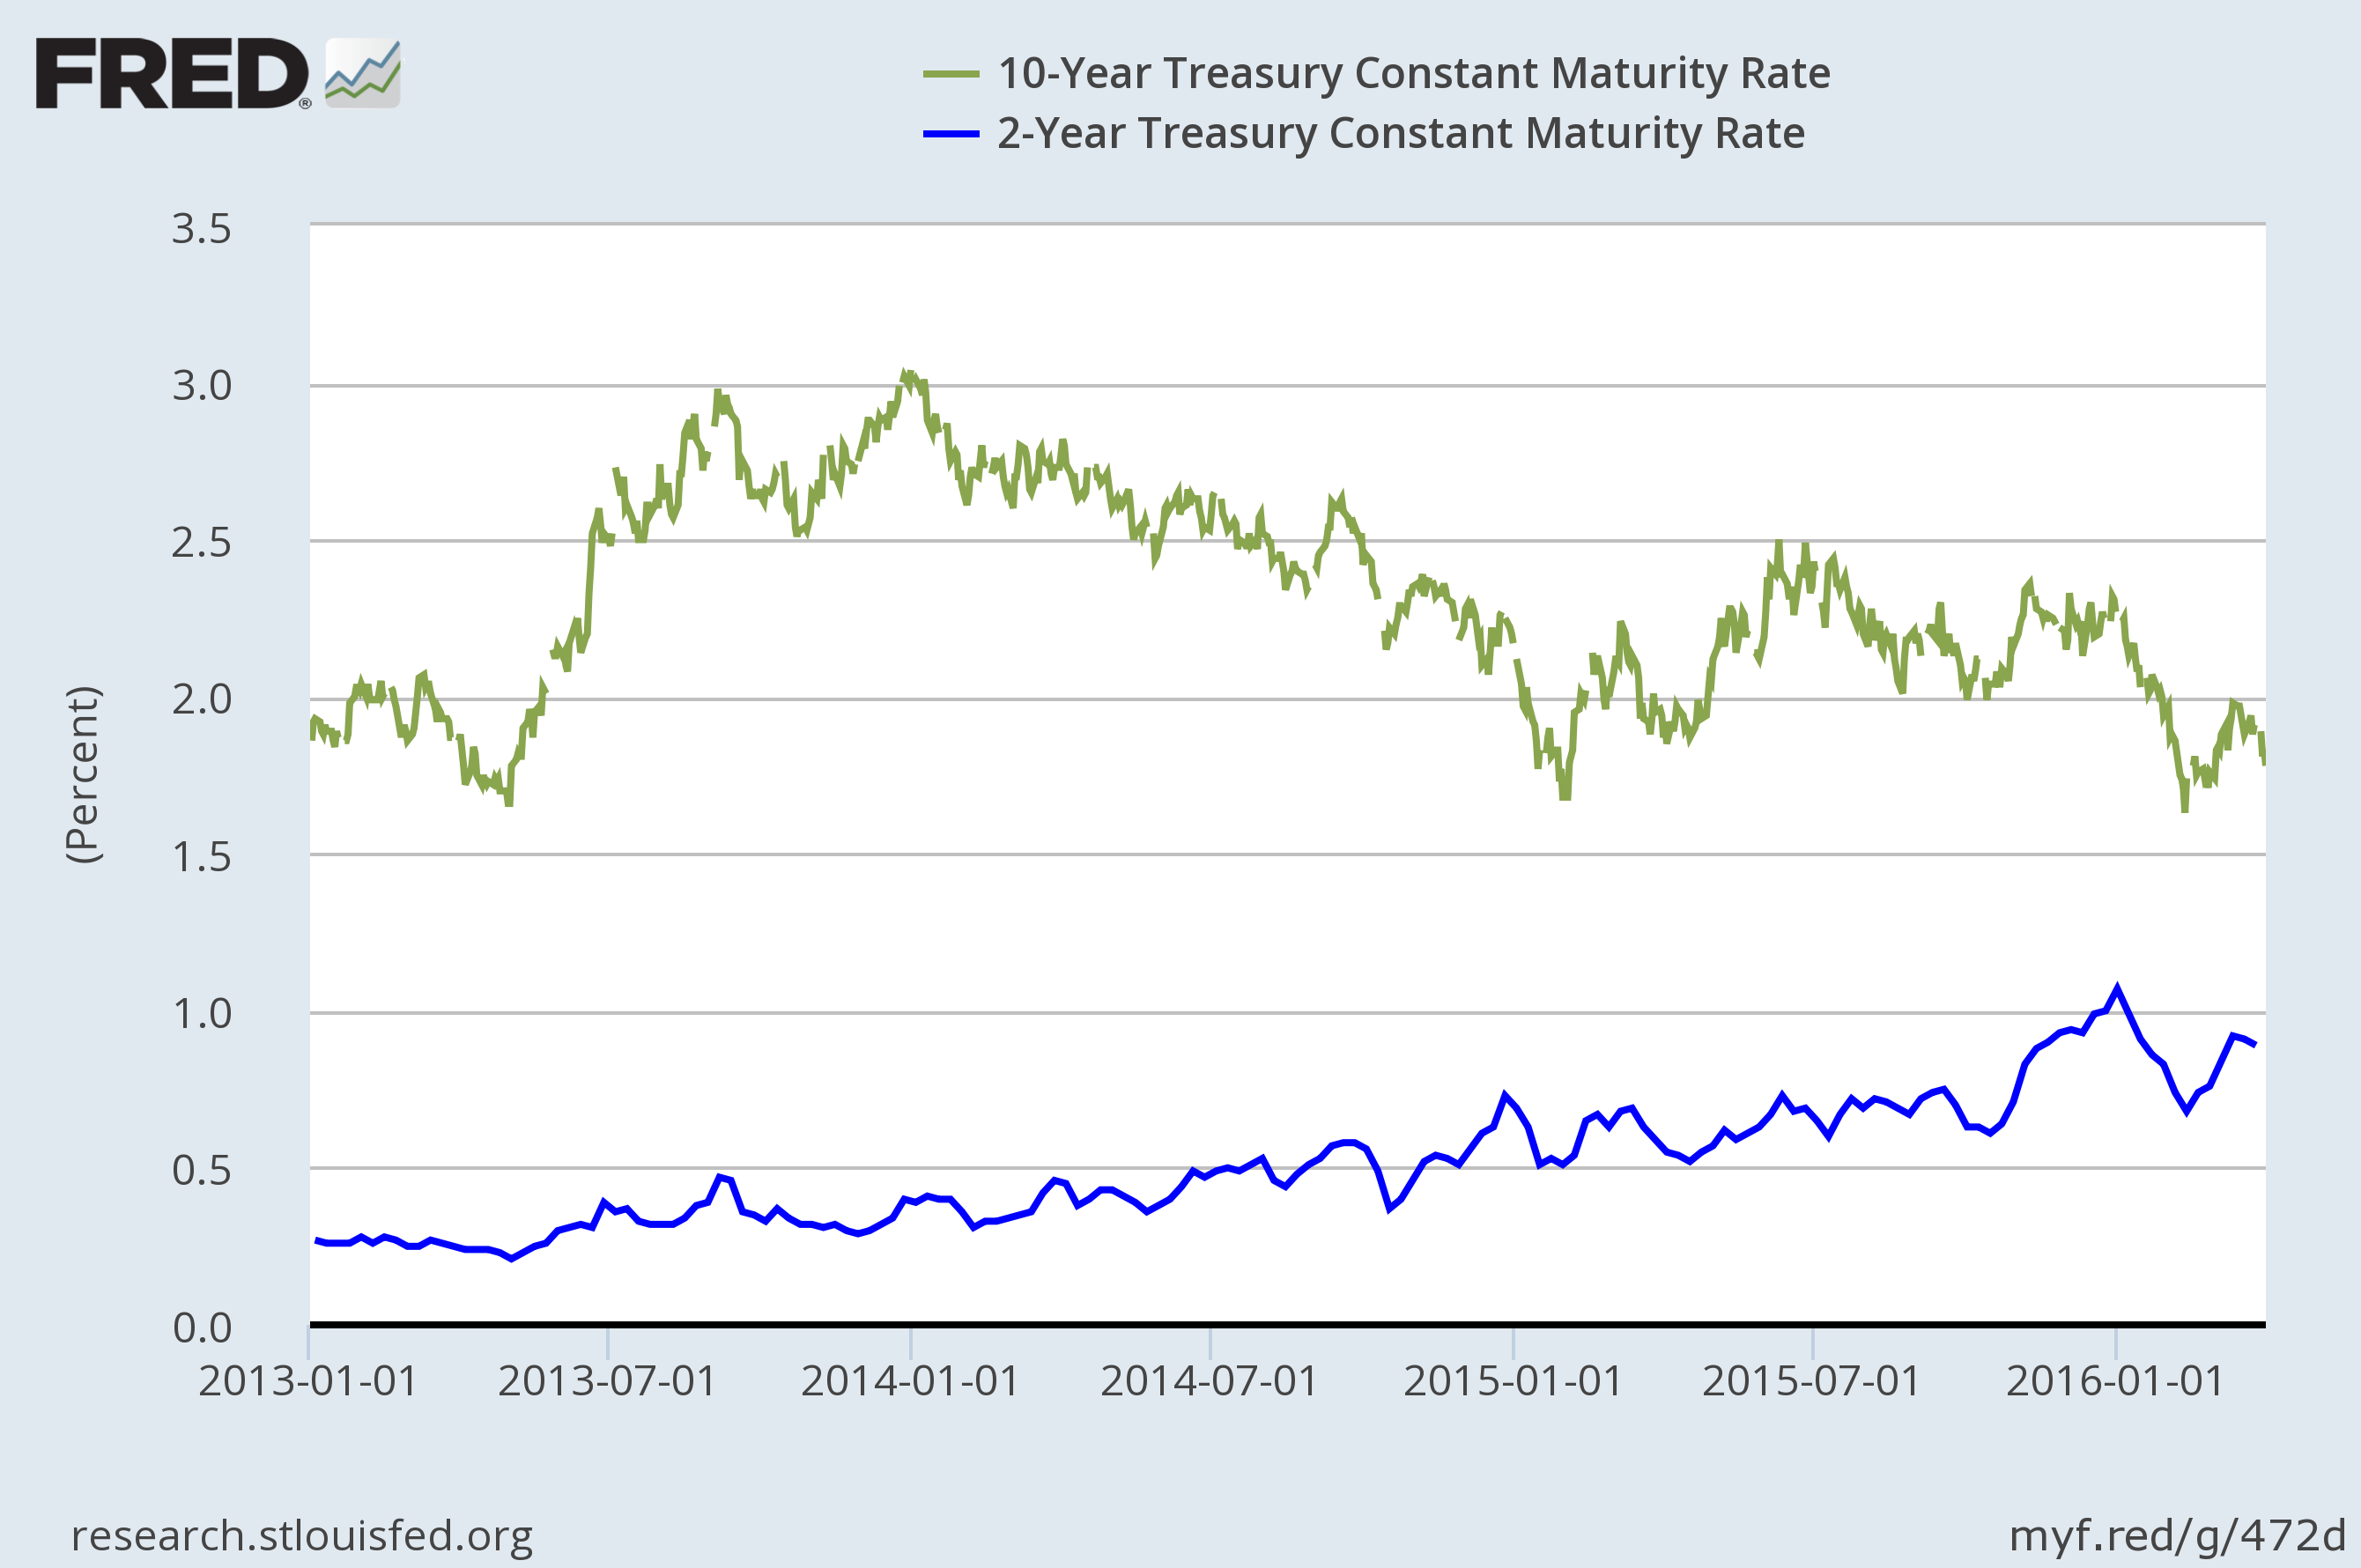
Friday morning, February 2, the U.S. Department of Labor released the Employment Situation Report for January. The report showed solid job growth, a bit larger than expected though not surprising given preliminary data. But the focal point was a 0.3% jump in average hourly earnings. When combined with revisions to previous data the average hourly earnings were up 2.9% year-over-year, the highest wage growth rate since May 2009. There had been a burgeoning assumption that the strengthening economy and a tightening labor market would invite higher wages and wage-based inflation pressures dormant for years. That report gave data-centric life to that assumption, and offered a reasonable basis for the U.S. Federal Reserve to move forward with a more aggressive pace of interest rate increases. Anticipation caused bond prices to fall, pushing U.S. Treasury yields to multi-year highs. The U.S. 10-year Treasury yield, the yield upon which much debt in the U.S. is benchmarked, rose 50 basis points to 2.90%, hitting its highest point since late 2013. Negative headlines warning of rising interest rates that would slow global growth, undermine corporate earnings despite tax reform measures, and insure a ballooning U.S. budget deficit was all that trading algorithms needed to queue up the sell orders. But, the day was still young, and there was more drama to come.

Chart 1: U.S. Treasury Yields

Interest rates are moving steadily higher.

2YR, 10YR, 30YR Constant Maturity Treasury Yields

When wrapping up the Q4 2017 Outlook I stated that if we do discover a fly in the ointment with respect to this market, it will come through one of three windows: interest rates, currency values, or commodity prices. Though on-the-money about interest rate risk, I did leave off one important item: domestic political risk. That same Friday was also the day that Trump authorized the release of a GOP House Intelligence Committee memo alleging bias at both the FBI and the Justice Department. The release and the associated headlines accelerated Friday’s sell off given that it compounded political uncertainty in front of the following week’s federal government spending deadline.

Although upon release of that Employment Situation Report markets experienced a 29% spike in the CBOE VIX Index, the most meaningful volatility shock would not come until the following Monday. Having had the opportunity to digest the weekend headlines, programmatic trading drove markets down fast and hard. The VIX experienced a single-day spike of 116%, the largest one-day spike ever recorded. That day also saw the largest single-day point decline ever recorded for the Dow Jones Industrial Average. Over the course of February’s first few trading sessions investors watched the first drawdown of more than 10% since early 2016.

Chart 2: CBOE Volatility Index

A return to historically average volatility following a tranquil 2017.

CBOE Volatility Index: VIX

Although markets quickly rebounded, recovering about 8% of the lost ground, volatility remained elevated. In stark contrast with historically tranquil 2017, markets spent the balance of Q1 alternating between episodes of relief and panic. It was a pattern of strong moves to advance, only to then stumble in field packed with distractions. Those distractions would once again, at the end of Q1, cause markets to weaken and give back much of February’s recovery. In the end, for the first quarter in ten quarters, most market indexes finished in the red.

  • The S&P 500® Index finished Q1 with a total return of  -0.76%.
  • The more concentrated, and more interest-rate sensitive, Dow Jones Industrial Average finished Q1 with a total return of -1.96%.
  • Small- and mid-sized U.S. companies, as measured by the Russell 2500 Index, outperformed large-company counterparts with a total return of -0.24%. Small- and mid-sized U.S. companies were less affected by the increasing frequency of Trump tweets threatening tariffs and trade-wars as less of their earnings depend upon overseas transactions.
  • The bright spot in the U.S. during Q1 was the technology and consumer-cyclical heavy NASDAQ Composite Index with a positive total return of 2.59%. For the NASDAQ, the story was not so much that it was hit less hard by the downturn, rather it had such a large head start during the month of January that when the downturn hit there was more cushion to keep the index from turning negative.
  • Foreign market performance during Q1 was comparable to the U.S. market performance. Foreign, large-company portfolios as measured by Morningstar, Inc. finished with a  total return of -0.86%. Foreign, small-company portfolios as measured by Morningstar, Inc. finished with a total return of -0.38%. Emerging markets were a bright spot during Q1, finishing with a positive total return of 2.01% as measured by Morningstar, Inc.
  • Bond markets, in the face of rising global interest rates, provided little shelter for investors. Interest rates and bond prices are inversely related, so as interest rates increase, bond prices fall. The Bloomberg Barclays U.S. Aggregate Bond Index finished Q1 with a total return of -1.46%. The Bloomberg Barclays US Aggregate Bond Index is a broad-based benchmark that includes U.S. Treasuries, government-related, and corporate securities.
  • For context within broadly balanced portfolios, as most Lake Jericho client portfolios are some balanced average of these various asset classes, the Morningstar, Inc. Moderate Allocation category total return during Q1 was -1.26%. Morningstar, Inc.’s Aggressive Allocation category total return during Q1 was -1.14%. Given the differences in allocations, yet with somewhat similar returns, it is easy to see that in times of heightened market volatility most asset classes do tend to move with a high degree of positive correlation.

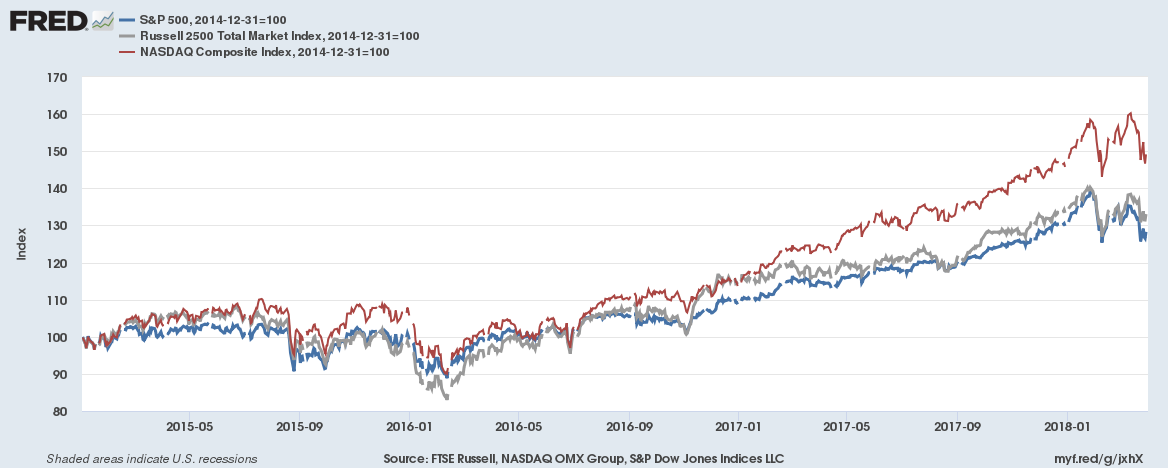
Chart 3: U.S. Equity Returns Over Time

The NASDAQ continues to pace the field.

Graph tracing the growth of the S and P 500, Russell2500 total market index, and the Nasdaq index.

Getting to the specific decisions that influence Lake Jericho client portfolios, I will briefly cover the quarterly results of each of the five levels of our portfolio construction process. As a reminder, no client portfolio will match perfectly target portfolio allocations, sector allocations, or percentages in each, as every client portfolio is unique. Unique factors (portfolio start dates, timing of asset transfers, timing of individual contributions or distributions, overall risk profile, etc.) impact strategic and tactical decisions and the performance attribution of each. However, what follows will generally inform you of the influences upon your portfolio. Clients should carefully review their individual portfolio information to understand how their portfolio is impacted.

International versus U.S. ( Contribution)

For Q1, international equity versus U.S. equity strategy decisions versus a market neutral portfolio contributed about 0.03% of additional performance to the typical Lake Jericho client.

Our overweights to international investments, particularly small-company developed market and emerging markets served as a meaningful contributor to client portfolio performance during 2017. The contribution during Q1 was much more subdued, but still positive. Foreign equities remain undervalued in our view, trading at significant discounts to U.S. equities.

On a total return basis the S&P 500® lost 0.76% during Q1, but the rolling one-year total return of 13.99% still bests any reasonable long-term return expectation. The Dow Jones Industrial Average (DJIA), on a total return basis, lost 1.96% during Q1, but remains higher by 19.39% on a rolling one-year basis. The largest Q1 and rolling one-year gains among U.S. diversified funds were among large-company, growth-oriented funds. The NASDAQ Composite Index supports this showing a total return of 2.59% during Q1. On a rolling one-year basis, the NASDAQ continues to outperform with a total return of 20.76%. The rolling one-year results for each of these three major U.S. large-company indexes remain among the best numbers seen in fifteen years, a reminder that keeping a long-term perspective is always best.

The MSCI All-country World Index Ex-US (a measure of large- and mid-sized companies throughout the world’s developed and emerging market economies, excluding US equity securities) finished Q1 largely inline with U.S. counterparts with a total return of -1.18%. The rolling one-year total return was 16.53%. Our foreign, small-sized company exposures fared even better with a positive return of 0.04% for Q1 and a rolling one-year total return of 19.60%. Emerging markets, as measured by Morningstar, Inc. bested all with a Q1 total return of 2.01% and a rolling one-year return of 22.90%.

Bonds versus Stocks ( Contribution)

For Q1, bonds versus stocks strategy decisions versus a market neutral portfolio contributed about 0.11% of additional performance to the typical Lake Jericho client.

Interest rates are on the move higher. As long as the move is reasonably paced then that move over time can be deftly managed. Lake Jericho managed portfolios are defensively positioned against the impact of rising interest, in terms of lower allocations to bonds than is considered typical, in how we constrain allocations to equity investments with high negative correlation with interest rates (real estate, utilities, consumer staples, heavily leveraged sectors), and in how we position the bond investments that we do hold. We believe that this defensive position is best in the current environment as yields provide little protection from sudden and large adverse price movements should rates move quickly higher.

While certain elements of our defensive position might not add to portfolio returns in many environments, our positioning provides relatively inexpensive volatility insurance. While our bond positions were a headwind for clients during 2017’s outstanding equity market performance, the way in which we construct exposure was less costly to portfolios than the way in which more traditional managers might implement bond investments. During the volatility of Q1, a period in which bonds provided little cover, our bond construction performed exactly as designed and was a net contributor to positive performance in the typical Lake Jericho managed portfolio.

Small Versus Big ( Contribution)

For Q1, small- and mid-sized company strategy decisions versus a market neutral portfolio detracted from performance for the typical Lake Jericho client by about 0.07%.

One of Lake Jericho’s fundamental portfolio convictions is that investors should maintain an exposure to, if not an ongoing overweight towards, small- and mid-sized company equity investments across time. While on average, over the long-run, the space can provide superior investment returns versus large-company peers, much of the excess performance can occur in short, unexpected time periods. We are not in the business of predicting these patterns or trading these patterns, rather we hold as efficient of an exposure to this space as possible over time. This pattern of return, and our persistent holdings, can result in extended periods of underperformance. Our approach to manage this trade off is to employ across time three different strategies, simultaneously, that best expose portfolios to persistent factors of return within the space. This strategy works well across time. However, one of the three strategies embedded in our approach is particularly sensitive to market momentum, and as a result underperformed other small- and mid-sized strategies in the recent downturn.

To fairly evaluate our process in the small versus big category, we look to the Russell 2500 Index for comparisons. The Russell 2500 Index is a broad measure of blended strategies in both small- and mid-sized U.S. company stocks. For Q1, the Russell 2500 Index returned -0.24%, besting the S&P 500® return by 0.52%. Due to the breakdown of the momentum factor during Q1, our strategy somewhat lagged not only the Russell 2500, but also the S&P 500®.

Value versus Growth ( Contribution)

For Q1, value versus growth strategy decisions versus a market neutral portfolio detracted from performance for the typical Lake Jericho client by about 0.39%.

As with small- and mid-sized company exposure, Lake Jericho managed portfolios maintain a constant exposure to, and ongoing overweight towards, value-oriented investments. The basic premise of value investing is that certain securities are underpriced bargains and are likely to outperform once their “real value” is fully appreciated by investors. If for no other reason, it is a bit of common sense supported by the statistics that if you remain mindful of not overpaying for your investments then you are more likely to achieve superior returns over the long-run. Value-oriented investing is one method that helps investors achieve this objective. A gross over-simplification of an entire field of financial study, but that is the basic idea.

Like our decisions in the small versus big category, performance patterns in the value versus growth category demonstrate “clumpy” patterns of return. While on average, over long-run periods value-oriented strategies provide superior investment returns versus growth-company peers, extended periods of meaningful underperformance can persist. Leadership does turn, and the relationship normalizes over time.

To fairly represent value versus growth factors in the markets we use Morningstar, Inc. measurements. During Q1, U.S. value funds trailed U.S. growth funds by 6.97%. The rolling one-year difference in total return advantage of U.S. growth funds over U.S. value funds has been 16.01%. That 16% difference is among the greatest spreads in value underperformance in such a compact time frame in measurement history. That degree of performance differential, though rare, certainly feels painful in the short-run. Our strategy and implementation in the space held up well, and we look at the current valuation differences as an opportunity for future outperformance more than as a negative for recent performance. All one need do is look back to 2016, a period in which the spread of value over growth extended to 17.63%, to understand how these patterns reverse in meaningful ways.

Sector Overweight/Underweight Decisions ( Contribution)

For Q1, sector overweight/underweight strategy decisions versus a market neutral portfolio contributed about 0.32% of additional performance to the typical Lake Jericho client.

Strategic and tactical sector weighting, the fifth aspect of our portfolio construction process, is an important part of how we add real, long-term value for our clients. Our process of underweighting U.S. equity market-neutral benchmark allocations in favor of overweighting those sectors that we expect to outperform the market average have been a meaningful tailwind for client portfolios over time. Our sector overweights are currently materials, financials via regional banks exposure, and healthcare via medical devices and technology.

  • While materials had a rough Q1 due to global macro concerns (finishing down by 5.45%) it has been a strong performer for the last couple of years. We continue to hold the positions due to our continued outlook for global economic expansion and what we expect to be resulting commodity price inflation. Post Q1-end, materials is among the market leaders in terms of recovery for just those reasons.
  • While the financial sector generally struggled during Q1 finishing down by 0.98%, our overweight is specific to regional banks which added 2.94% in total return during Q1. We believe that regional banks in the U.S. are best positioned to benefit from a combination of lighter regulation, and higher loan growth rates loan particularly in the energy field as U.S. capacity once again ramps up in response to rising crude prices.
  • The healthcare sector generally struggled during Q1 finishing down by 1.29%. Our overweight is specific to the Medical Device and Technology industry sector which provided a 6.64% in total return during Q1.

By necessity, when we apply sector overweights in the U.S. to industries such as materials, regional banks, and medical technology we are as well imbedding underweights to those sectors that we believe will perform poorly in the near term: real estate, utilities, consumer staples, and similar sectors that struggle under inflation and rising interest rates.

Near Term Outlook

Economic and political headlines continue to whip up anxiety like a photo finish between an odds-on favorite and the long shot. No denying that the headlines are cause for concern; monetary tightening by central banks around the world, rising global interest rates, late-cycle fiscal stimulus in the U.S., media pundits volleying around terms like “stagflation”, budget deficits, tariffs, and trade wars. Concern is a natural and expected reaction. But it is too early to be whipping these anxieties across what is still an imaginary finish line. Among our primary measures of economic and market health (global growth, corporate earnings outlook, asset pricing multiples), each indicate that equity markets on average have more room to run.

  • The U.S. economy continues to grow, and the full impact of the Tax Cut and Jobs Act of 2017 is expected to enhance the rate of growth in the near term. The injection of two rounds of budgetary stimulus are more difficult to evaluate in the near term. Forecasting the outcome of the U.S. tax cuts and fiscal stimulus measures combined so late in an economic cycle is, frankly, a guessing game. If anyone tells you otherwise, smile politely and change the subject.
  • Global economies continue to grow, despite some weak data reported during Q1 that caused concern. Emerging economies are showing particular strength.
  • The U.S. Federal Reserve’s plans to slowly increase interest rates has been well communicated and implemented accordingly. The same cadence is being followed by central bankers across the globe. While in the midst of handwringing over rising rates, we should not forget that interest rates remain at historically low levels.
  • First quarter corporate earnings are expected to increase 20.0% or more from Q1 2017. Of the companies in the S&P 500 Index that have reported earnings to date for Q1 2018, 79.3% have reported earnings above analyst expectations. This is above the long-term average of 64% above, and also above the prior four quarter average of 72% above. Admittedly, estimates peg 8% of the 20% as a direct consequence of tax-law changes rather than improved corporate performance. But even a significantly reduced earnings growth number still means positive earnings growth, and the ability to grow into the price multiples.
  • Equity values might generally be considered stretched, if not expensive. But they are certainly less so than they were at this point last quarter. By the most commonly used measure of value, the trailing price-to-earnings (P/E) multiple, U.S. stocks are at least fully priced. However, if companies can grow corporate earnings 20% in 2018 (like they did in Q1), or even the lower 12% estimated once removing tax implications, then equities appear modestly attractive at that multiple. Sure, certain sectors remain a bit too rich for our taste. Some of the technology sector and the consumer cyclical space is priced more like Millionaire’s Row while we prefer to pay Granstand admission prices. But great value, and winning payouts, are still to be had.
  • On the geopolitical front, concerns have increased about tariffs and trade wars. But the smart money is betting that the media circus is more of a stare-down tactic than it is a willingness to tear up the track so no one else can win.

The critical consideration for investors is deciding if this increased volatility is just a normal adjustment in an otherwise healthy market or is it a symptom of something more serious? No denying that we are late in the current economic cycle and that being late-cycle does call for increasing cautiousness. But for each of the concerns listed above, the reality is that the risk is more subdued than the fevered pitch of the crowd indicates. Neither the data, nor market sentiment, support a claim that this record market run is over. At Lake Jericho, we believe the winning strategy from this point forward is to remain in our lane, running our race. If that means that we run the home stretch wearing blinders, so we will not be distracted by the noise and flash of the field, so be it.

We remain watchful and ready to respond should we see signs on the horizon sufficiently impactful to change our near term outlook. As always, I am available at any time, any day of the week, to discuss specific portfolio performance questions. I will also be in touch with each of you in the coming weeks to follow up on Lake Jericho’s rollout of its financial planning platform and capabilities. Until then, be well, enjoy the rest of your week, and thank you!

A.J. Walker, CFA CFP® CIMA®
Founder, President, and CEO
Lake Jericho, LLC

1st Quarter 2017: Quarterly Recap and Near-term Outlook

The thing about crafting a useful Recap at each quarter’s end? There are times when everyone needs a break from my idea of “useful”. After that weighty tome that I posted as Q4 2016 Commentary? I owe everyone a break for Q1 2017. Never mind that recent shoulder surgery has also rendered me a one-fingered, hunt-and-peck, kind of communicator. For your benefit, and the benefit of my much needed healing, this quarter I am providing a more brief summary to inform you of the factors influencing client portfolios during Q1.

Q1 Review.
Q1 2017 started with high expectations that the incoming Trump administration would deliver on fiscal (spending) stimulus and regulatory relief, both then allowing the Federal Reserve’s FOMC to normalize monetary (interest rate) policy. Economic data, employment, and consumer confidence, were generally strong during Q1, contributing to the Federal Reserve’s March decision to raise short-term interest rates for the second time in four months. Improving economic data served to bolster business and consumer confidence in the strength of U.S. economic growth. Investors remained generally upbeat that a Donald Trump presidency would result in pro-growth policy changes, even though doubts began to mount, and pockets of trouble with select “Trump trades” emerged, after the failed efforts to reform both immigration and healthcare in the first attempts.

A sell-off in energy markets driven by a surge in North American production led investors to question all of the reflationary trades. A 6.58% sell-off in energy, and similar action in select commodity investments, lead to a mid-quarter flight away from risk assets (cyclical equities) and into safe-haven assets (counter-cyclical equities and bonds). This flight to safe-haven assets helped push to interest rates down again even though the FOMC was moving to raise rates. The darlings of the immediate post-election period (small company stocks, financial stocks, infrastructure stocks) all stalled during Q1. Otherwise, U.S. stocks generally continued their trend higher during Q1 with the S&P 500 (measure of large-company U.S. stocks) up 6.07% on a total return basis. The Russell 2000 Index (measure of small- and mid-sized company U.S. stocks) was up 2.47%. International equities bested U.S. counterparts as measured by the MSCI All Country World Index (ex-US) returning 6.37% for Q1. U.S. bonds, despite a lot of news coverage of the FOMC’s policy moves regarding interest rates, did not really do much during the quarter. As measured by the Barclay’s U.S. Aggregate Bond Index, U.S. bonds added about 0.82% for Q1.

All of our client portfolios can generally be categorized as moving along one of three paths during Q1.

(1) With meaningful growth in new relationships and significant new deposits from existing clients during Q4 2016 and Q1 2017, many client portfolios were in a purposeful and steady process of moving towards full investment. Our decisions here were less about macro-strategy structure than they were about taking advantage of market opportunities when presented to execute that strategy.
(2) For many existing client portfolios with more aggressive risk positions, prior to the 2016 Presidential election we had put in place an investment constructed purely for downside protection. We talked a great deal about this in the last two quarters. During the post-election period and throughout Q1 2017 we were methodically reducing, and ultimately eliminating, this protective position as President Trump’s early agenda came into focus. As the protective position was reduced we moved these client portfolios back towards full investment. Our tendency for these portfolios, however, was when moving back towards full investment to dial back unique sector exposures and towards our core target portfolio. Our preference is to be more focused on targets while waiting to see how actual implementation of Trump’s agenda progresses.
(3) For all other client portfolios, Q1 was a fairly uneventful time period in which we executed a number of rebalancing transactions to maintain full investment, but did not undertake significant changes in long-term strategy.

Getting to those long-term, strategic positions that influence Lake Jericho client portfolios, let’s briefly cover each.

U.S. versus International.
The worldwide recovery in industrial activity continued to drive global expansion. While political uncertainty surrounding U.S. economic policy caused a few reversals in post-election, policy-related trades, that uncertainty helped drive down the value of the U.S. dollar. Supported by a weaker dollar, international equities led the global stock market rally for the first time in several years. Emerging-market equities outperformed U.S. large-company stocks on a one-year basis. Our overweights to international investments (with small-company, and emerging market overweights imbedded in those investments) served as a meaningful tail-wind for clients. Our method for building international exposure bested aggregate U.S. equity exposure by 2.22% to 3.82% during Q1. With international exposures of approximately 25% of client portfolios, this added from 0.55% to 0.95% of additional return to client performance during Q1 versus an all U.S. equity portfolio.

Stocks versus Bonds.
Lake Jericho managed portfolios have been defensively positioned against the threat of rising interest rates for the last two years. At times this has hurt performance, and at times it has helped performance. We continue to believe, on balance, that a defensive position is best. However, the way in which a defensive position is constructed is the most important part of the decision to be defensively positioned. Because we structure our fixed income exposure in a statistically somewhat disconnected relationship to standard measurements (again a gross over-simplification) we were able to best the U.S. Aggregate Bond Index by 1.90% during Q1, returning 2.72% for the typical client fixed income position.

Small versus Big.
During 2016, our small- and mid-sized company positions bested large-company U.S. equity investments by 8.60%. As stated above, the Russell 2000 Index returned 2.47% for Q1, 3.03% behind the aggregate U.S. market for the Quarter. For Q1, our small- and mid-sized company positions returned a weighted average of 3.21%. Our construction bested the Russell 2000 Index by 0.74%, but still lagged the aggregate U.S. market by 2.70%.

Investor portfolios should maintain an exposure to, if not an ongoing overweight towards, small- and mid-sized company equity investments at all times. The basic premise is that, although small- and mid-sized companies are inherently more risky in the sense that more of them fail than do big companies, those that do succeed are sufficiently successful such that the return distribution for broadly diversified holdings (mutual funds, ETF’s) is skewed towards superior returns in the long run. So why would one not simply invest 100% of their portfolio in small-company equities and call it a day? Investors are often misinformed, thinking that all risk translates directly into extra reward in the long-run. There is no evidence to support that position. We attempt to coach this often misled belief away from client’s cognitive biases and replace that with a belief in and trust in broadly diversified and efficient risk exposures.

Q1 is an example that in the short-run market leading performance rotates through sectors. 2016’s market-leading performance is an example of why you always want to have some exposure to the space. But none of these time-periods support a position, statistically, that risk taking simply for risk’s sake is its own reward. Statistically, there exists an approximated optimal allocation of small- and mid-sized company exposure to be held in investor accounts that add value over time without exposing too great a level of variability in portfolios. Our answer to best manage this trade-off over time without engaging in unnecessary trade execution is to maintain a fairly constant exposure to the spaces, and to employ three different strategies in the space to best gain exposure to persistent factors of return within the space.

Value versus Growth.
Investor portfolios should maintain exposure to, if not an ongoing overweight towards, value-oriented investments. The basic premise of value investing is that certain securities are underpriced bargains and are likely to outperform once their “real value” is more appreciated by investors. It is a bit of common sense, supported by the statistics, that if you remain mindful of not overpaying for your investments then you are more likely to achieve superior returns over the long-run. Value-oriented investing is one method that helps investors achieve this objective. A gross over-simplification of an entire field of financial study, but that is the basic idea.

Last year, U.S. value equity funds as a group were up 20.79%, according to Morningstar, while U.S. growth equity funds as a group rose only 3.16%. As a value-biased portfolio manager, Lake Jericho clients certainly benefited from that differential during 2016. But with the overwhelming outperformance of our value-biased strategy during 2016, and of certain elements of value-oriented strategies during Q1 2017, one must naturally question the current wisdom of this strategy. Is there a point when the very success of value-biased strategies take away their promise? The reality is that, in the investment arena, all things are cyclical. As our focus is on long-term, strategic positions and not on attempts to trade timing patterns, it is the manner in which we execute our value-bias that is most important.

Sticking with Morningstar measurements, during Q1 2017 U.S. value funds as a group were up 2.58% while U.S. growth funds as a group rose 8.58%. With that type of performance differential during Q1, how could the Lake Jericho managed portfolio compete? Again, I offer a gross oversimplification, but there are two ways in which we managed to offset that performance gap. First, our value-biased positions had increased in value so significantly during 2016 (particularly post-election) that they began to behave statistically more as growth-oriented counterparts. This is a natural outcome of such price appreciation combined with a tendency to buy and hold long-term investments. Second, much of our value bias is represented by both domestic U.S. equities and international market equities. During Q1, international markets simply outperformed U.S. markets. Putting both factor exposures together, our target value bias was able to best the aggregate U.S. market by between 1.8% and 3.4% in client portfolios.

Sector Allocation Decisions.
Finally, strategic and tactical sector weighting, the fifth aspect of our portfolio construction process, was an important part of how we added value during Q1. Few portfolios will match all sector allocations, or sector allocation percentages exactly, or the timing of investments perfectly, and these factors certainly impact exact contribution to performance of our sector decisions. However, our process of underweighting U.S. equity market-neutral benchmark allocations in favor of overweighting higher expected growth sectors (currently materials, medical devices and instruments, pharmaceuticals, biotech/genomics, and early additions to a regional banks exposure) added between 0.46% and 0.53% in excess return to client portfolio during Q1. Materials, medical devices, and biotech/genomics contributed to performance, while the pharmaceutical sector overweight has not performed as expected (but does continue to close its historical performance gap). For portfolios where we began to add exposure to regional banks (after the sector began a price-breakdown late in the quarter) those allocations were very late in the quarter and the overall impact was minimal. We will cover this sector decision in the coming quarters.

So where does that leave us heading into Q2? We continue to see upside in our long-term global economic growth estimates, with higher expectations for both foreign developed markets and emerging markets than for domestic markets. But simply put, client portfolios with limited exception are now fully invested and at long-term strategic targets. We foresee little activity for Q2 unless unforeseen events cause meaningful changes in long-term outlook. Other than period reviews and necessary rebalancing trades, Lake Jericho is in a profound period of “wait and see”. The French election this weekend, along with further international elections this year, and a bit of breathe holding regarding the pace of policy implementation in the U.S. causes us pause to make any strategic changes in client portfolios, near-term.

I am available at any time to discuss specific portfolio needs and performance questions. I will also be in touch with many of you in the coming weeks to conduct our regular and thorough review of goals and objectives, make any needed changes as a result, and to walk through a few administrative tasks that we need to tackle. Until then, be well, enjoy the rest of your weekend, and thank you!

A.J. Walker, CFA CFP® CIMA®
Founder, President, and CEO
Lake Jericho, LLC

1st Quarter 2016: Quarterly Recap and Near-term Outlook

The thing about crafting a useful investment review at each quarter’s end? It is often the case that one will need to construct a coherent discussion of what were actually two (or more) very different markets. The 1st quarter of 2016 is a tale of two halves.

2015’s volatility continued into the 1st quarter of 2016 amid much fretting about a possible U.S. recession, a lack of global growth, and the collapse of oil and commodity prices. U.S. markets were as close to an actual bear market not seen since the depths of the 2008 financial crisis. The bears had a lot of ammunition to make their case. Weak economic data at home fueled speculation that the U.S. economic expansion was coming to an end. Chinese stocks were crashing and many feared Beijing’s debt-fueled economy would follow suit. The prices of oil and commodities were in free fall. Bank stocks were tanking from fears of potential defaults within their energy loan portfolios. The U.S. dollar continued to climb as global demand for U.S. denominated assets reached a new peak, delivering a hit to earnings of U.S. multinationals. Global markets turned turbulent and wildly volatile. The Bank of Japan pushed borrowing costs into negative territory for the first time. Adding to market fears, most on Wall Street feared the Federal Reserve would soon make a second hike of short-term interest rates, and was likely to make too many hikes in 2016.

The S&P 500 (a measure of the largest 500 U.S. companies) opened 2016 by falling 1.5% on the first trading day of the year. At the end of the first week of the year the S&P 500 was down 6.0%. And though the market bounced about the following weeks, the S&P 500 would find its bottom on February 11th with a 10% total decline for the quarter. Other sectors of the market would fare far worse. The Russell 2500 Index (a measure of small- and mid-cap U.S. company stock performance) was down 14.0% at the February 11th bottom. International equity markets, generally expected to provide some measure of diversification and shelter from U.S. market volatility, were also down sharply. As measured by the FTSE Ex-US Index (a comprehensive measure of non-U.S. publicly traded companies), international stocks were down about 11.0% at the February 11th bottom. At the peak of pessimism on February 11th the Dow Jones industrial average closed nearly 15.0% below its May, 2015 record high.

After hitting the panic button in the first half of the quarter, investors regained some composure mid-February. One by one, the fears and obstacles that had put the U.S. stock market on the brink of its first bear market in 7 years began to dissipate. In a sharp reversal of outlook, markets shrugged off global concerns and rallied aggressively through quarter-end. The S&P 500 finished +1.35% for the 1st quarter. The small- and mid-cap company Russell 2500 Index finished +0.3% for the 1st quarter. International equities as measured by the FTSE Ex-US Index finished the quarter lower by about 0.6%. Emerging market equities outpaced developed markets by about 2.3% finishing in positive territory for the 1st quarter.

Relative Performance: S&P 500 Index vs. Russell 2500 Index (Small- and Mid-Cap)
Relative Performance: S&P 500 Index vs. Russell 2500 Index (Small- and Mid-Cap).

Early during the first quarter any type of reversal seemed unlikely. So what happened? Arguably, the market simply was oversold and due a big bounce. While true, a bounce has to be kicked-off by some thing, or some group of things. This bounce got its kick largely from a recovery in energy and commodities prices, from a few bits of improved macroeconomic data, a steady hand by central banks both in the U.S. and abroad, and a weakening U.S. dollar.

  • Energy and Commodity Prices.

Without question, the most influential market variable in the past 15 months has been oil and commodity prices. While cheaper energy and lower commodity prices are good for the typical consumer in the long run, there exists a delay in the short run translation of those consumer benefits into meaningful economic impact. In the interim, the cyclical (business cycle change) and secular (permanent change) impact upon energy related companies (upstream or downstream), mining companies, heavy equipment manufacturers, transportation (railroads, shipping, trucking) companies, has been devastating to earnings. When earnings drop, stock prices drop. It was no surprise that continued weakness in oil and commodities during the 1st quarter translated directly to weakness in the stock market. And equally without surprise, was the turn higher in stock prices coincident with the turn in energy and commodity prices.

Q1 2016: Price Patterns of WTI and Materials.

It is no coincidence that on the same day stocks bottomed that U.S.-produced oil (WTI) hit a 13-year low of $26.21 a barrel. When oil, which was down nearly 30% in 2016 and 80% from its high, stabilized, that lifted pressure off of energy and energy-related firms struggling to meet their operating income needs and to make debt related payments on time. Rising oil prices also relieved pressure in credit markets tied to the oil/energy complex. In reality, this was the turning point that sparked the market’s recovery.

Q1 2016: Price Relationship of WTI and S&P 500.

Crossing the $40 p/barrel mark near quarter-end was a meaningful accomplishment as this level provides much relief to energy and energy-related companies. And while a $45 p/barrel mark is widely considered an industry average breakeven price, to cling to the $40 mark in the near-term is an important support level. We shall see if anticipated OPEC production cuts later during 2016 actually occur. IF they come to an agreement, and IF they abide by that agreement, then a meaningful move higher in the price p/barrel could occur in the summer and fall of this year. A price in the neighborhood of $50 p/barrel would likely soothe the markets. A price anywhere close to $70 p/barrel and we will then likely start talking about oil as getting “expensive” again.

  • Economic Factors.

The start of 2016 was plagued by concerns that the U.S. (if not the globe) was heading into recession. The reported upward trend in initial jobless claims caused immediate concern. Historically, initial jobless claims have tended to trough several months before unemployment starts to rise. This triggered fears that the steady fall in the unemployment rate that has supported the 7-year recovery could be coming to an end. Revisiting last quarter’s discussion of the math behind stock prices, we know that even small changes in long-run growth expectations will have a large impact on current stock prices.

However, initial jobless claims are naturally more volatile than the longer-term unemployment rate and often give false warning signs. Since mid-February, the trend in initial jobless claims improved, calming market fears about the U.S. labor market. Considering some positive news from the Household Labor Force Survey, and strong job openings data, stock prices began their lift-off in the second half of the 1st quarter.

Another source of concern at the start of the year was the continued weakness in U.S. manufacturing. While not a robust measure of hard data, The Institute for Supply Management (ISM) Manufacturing Survey is a widely followed report and can be useful for quick signals on economic activity. The ISM reported survey data in both January and February signaling a contraction in manufacturing underway since the latter part of 2015. More recently, the index data has bounced back into positive territory (indicating an expansion of manufacturing), and the Regional Manufacturing Surveys have also shown some signs of improvement.

While manufacturing accounts for 14.0% of U.S. GDP, the non-manufacturing component of the Survey (the services sector of our economy) is a more influential element at about 77.0% of GDP depending upon the measurement. While the non-manufacturing index data remains positive (continues to indicate expansion) service sector rate of growth has been slowing for 5 moths, and it will be important to watch this data-point closely in the months ahead.

Releases from major economies around the globe mirrored similarly weak fundamentals as the U.S. and fueled similar concerns throughout foreign markets. Central banks in those markets (the E.U., Japan, and China most notably) were forced to intervene in much more direct fashion.

Nonetheless, the U.S. economy is on more solid ground than thought as we opened 2016. While we will likely have another quarter or two of softness, including some revisions downward of these and similar numbers, our view is that we are simply experiencing a slowing of the rate of growth in the near term rather than a reversal towards recession.

  • Central Bank Actions.

Looking back through my daily notes for the 1st quarter, it appears that the seeds for the dramatic rebound were planted on January 27th. That is the day the Federal Reserve’s FOMC surprised markets by not hiking interest rates again immediately on the heels of the December hike. The markets were bouncing about in a range-bound fashion waiting for any signal that could provide direction for the next trading leg. Although the FOMC’s restraint did not immediately break us from the range-bound trade, the minutes from that FOMC meeting did send notice that the members were paying close attention to concerns at home, and to the mounting risks abroad. The Fed’s soothing words helped when they indicated that the pace of future interest rate increases would be affected by international events. Those seeds planted on January 27th sprung forth in the evening of February 11th in a confluence of events that signaled the change in direction.

Between the January 27th meeting and the market bottom on February 11th, there were signals that the market was in bottoming mode. Energy prices had slowed their free fall, and the number of stocks hitting fresh 52-week lows was no longer expanding. That latter statistic is a meaningful measure for most technicians. On February 11th, America’s unofficial central banker, JPMorgan/Chase CEO Jamie Dimon, cast a vote of confidence for his beaten down bank’s shares, and the stock market as a whole, when he put up more than $25 million of his own wealth to buy an additional 500,000 shares of JPMorgan stock. While not the “cause” of the turnabout, a lot of credit is given to Jamie Dimon with turning investor sentiment.

In the weeks that followed, the stock market got another boost from additional stimulus measures from the European Central Bank, steps by China to steady its economy and wild currency swings, solid economic data in the U.S. allaying recession fears, and a sharp rally in distressed assets powered by bearish investors reversing their negative bets. Fed Chair Janet Yellen added to the bullish tone and turnaround late in the quarter when in mid-March the FOMC dialed back its plans for interest rate hikes planned for 2016 from four to two.

In the bond markets, once the fear of rapidly rising interest rates abated, both government and corporate bond price indices moved to the upside. The 10-year Treasury yield fell from 2.27% at the end of December to 1.77% by the end of March (bond prices and bond yields move in opposite directions). The Barclay’s Aggregate Bond Index (a broad measure of intermediate terms fixed income investments) returned 3.03% for the quarter. We were not willing to take the risk that the FOMC would pause in its move towards higher rates. We have taken a more conservative position with our bond allocations for clients, choosing to remain invested at about a 2-year duration. A shorter duration investment (2-year) will not fall in price as dramatically as a longer duration (10-year) investment when interest rates increase. However, when interest rates fall the price of a short duration investment will not rise as dramatically as a longer duration investment. This is why our holdings returned about 1.6% for the 1st quarter.

Q1 2016: 10-Year Treasury Yield vs. 2-Year Treasury Yield.
  • Currency Impacts.

As we discussed in last quarter’s review, a strong dollar is good for U.S. consumers (we can buy more stuff from other countries), but not so good for U.S. businesses (they can not sell as much of their stuff to other countries). So while the consumer-based parts of our economy are helped, U.S. businesses that generate significant earnings abroad are hurt. Additionally, the translation effect on those foreign earnings mean that those U.S. companies lose when exchanging those earnings back into U.S. dollars (those foreign currencies can’t buy as many dollars). As with last quarter, the U.S. dollar is too expensive. But it did get a little cheaper during the last half of the 1st quarter.

With a cheaper U.S. dollar, when a U.S. business generates earnings in foreign markets, and those earnings are converted back into U.S. dollars for financial reporting and tax purposes, they simply get more U.S. dollars in the exchange. When the value of the U.S. dollar is lower relative to foreign currencies, those foreign earnings, simply by exchanging them back into U.S. dollars, are suddenly worth more. U.S. companies keep more of what they earn overseas, their earnings increase and stock prices increase. It is a virtuous cycle, but one that is easily upset and can take many years to equilibrate.

Q1 2016: U.S. Dollar Index.

As always, we are keeping our eyes on all of the moving pieces across the globe and across markets. While much of 2015 and the first few weeks of 2016 did not favor some of our portfolio biases, most of our biases contributed solidly to client returns in the post-February 11th recovery.

  • Our overweighting of small-cap (+2.63%), mid-cap earnings (+3.65%), and mid-cap value (+1.73%) company indexes contributed nicely to excess return versus the S&P 500 during the 1st quarter.
  • Our overweighting of the materials sector (+4.64%), and the consumer discretionary sector (+1.61) contributed positively to excess returns versus the S&P 500 during the 1st quarter.
  • Healthcare represents one of the largest sectors of the U.S. economy. It is pervasive throughout every size and style category and encompasses an unimaginable breadth of related businesses. There are parts of the healthcare sector that we like very much, and some parts that we don’t like. During the 1st quarter the healthcare sector underperformed all other sectors with a loss of -5.90%. In our portfolios we create an effective underweighting of the general healthcare sector by creating overweights to specific sub-sectors within the healthcare sector. For example, we overweight medical devices and medical technology companies. Devices and technology returned +0.04% during the 1st quarter, below the 1.3% return for the S&P 500 but far better than the -5.90% for the general healthcare sector.While many of our biases contributed nicely to excess returns during the past quarter, there were a few biases that did create a drag on quarterly returns.
  • Continuing the healthcare sector discussion, in our large, growth oriented portfolios we also overweight biotechnology/genomics companies (-24.2%), and pharmaceuticals (-14.1%). While we maintain our conviction that these are fruitful areas for long-term growth, they are also more volatile than most sectors of the market and react more harshly to growth-related fears. As such, these sectors were among the most beaten down during the 1st quarter. And while one would expect that they also be among the quickest to recover, political pressures associated with the Presidential election cycle have influenced the sector in ways that are unrelated to fundamentals. We believe time and patience are the watchwords in these spaces.
  • All of our portfolios have large allocations to international markets, both international equities and international bonds. During the 1st quarter our method of executing comprehensive international exposure returned approximately -1.4%. We feel pretty good about this number actually when compared to many of the major markets across the globe. For example, the MSCI EMU (a representation of the 10 Developed European Monetary Union countries) returned -6.6% for the first quarter.We remain committed to our strategies for the long haul and see no reason to undertake any significant changes. We have, however, adjusted some of our sector performance expectations and in response will be making small changes in some allocations as opportunities present themselves during the 2nd quarter. Should significant events unfold you can be certain that we will provide updates as needed and advance notice of any significant deviations in portfolio strategy should market forces warrant them. We are available at any time, any day of the week, to discuss specific portfolio and performance questions. Until then, be well and enjoy the rest of your weekend!

A.J. Walker CFP® CIMA®
Founder and Senior Consultant
Lake Jericho, LLC