Lather. Rinse. Repeat. Continued.
When opening last quarter’s Recap I commented about the Groundhog Day type of experience that had been 2017’s investment market through the end of Q3. And when closing Q3’s Outlook I encouraged investors to relax, to enjoy the market’s calm and persistent upward trajectory. With no meaningful roadblocks on the horizon, and with few meaningful exceptions to the market’s push higher, Q4 was a welcome continuation of 2017’s lather, rinse, repeat theme. However, I am not wholly confident that clients were able to wash away worry that what goes up potentially comes back down. The two conversations clients initiated the most during Q4 were (1) is it time to sell everything and wait for a pullback, and (2) should I be buying Bitcoin? I will get to the first in a couple of paragraphs. I will not touch the second. Here at least.
Q4 Review
2017 was a great year for investors, with Q4 the strongest of the four quarters for U.S. markets. The persistent upward trajectory of markets pushed U.S. stocks repeatedly to new all-time highs. For the first time since its inception, the S&P 500 Index (a broad measure of large U.S. companies) was positive for each of the 12 months during the year, providing a total return of 21.8%. Although small company stocks (as measured by the Russell 2000 Index) lagged their large company counterparts, they too delivered a better than historical average total return of 14.6% for 2017. As forecast in prior Quarterly Recaps and Near-term Outlooks, most regions across the globe are exhibiting some degree of economic expansion, and on average international economies exceed the rate of growth in the U.S. In its most recent update, the International Monetary Fund projects that the U.S. economy will grow 2.7% in 2018 (up from prior projections of 2.1%) and that the world economy will grow 3.9% (up from prior projections of 3.7%). Rising global economic growth helped to fuel strong equity performance across most major indices for both U.S. and international markets during 2017. And despite a bit of weakness in international developed markets during Q4, both international developed markets (+25.6%) and emerging markets (+37.8%) outperformed U.S. markets over the full year.
Interest rates in the U.S. and internationally had a meaningful mid-year reversal from falling bond yields/higher bond prices back towards higher bond yields/lower bond prices (bond yields and bond prices have an inverse relationship). Even so, most U.S. bond sectors posted gains for 2017 despite a challenging Q4 during which U.S. Treasury yields climbed steadily. The U.S. dollar, as measured by the ICE Futures U.S. Dollar Index (DXY), ended the year lower by about 11.4% despite rising Treasury rates. Corporate bonds capped a good year with positive total returns. International bonds also experienced healthy performance.
Another supportive factor of the improving global growth theme, the Bloomberg Commodities Index (a price index based upon a broadly diversified basket of commodity items) posted a robust return in Q4 of +4.7% that finally pushed 2017’s Index return into positive territory at +1.7% for the year. While a 1.7% total return might seem paltry, after many years of commodity price deflation Bloomberg commented that while commodity values were still compressed, they are now “less depressed” and “on sound footings for 2018”. West Texas Intermediate crude traded above $60 per barrel in December, extending that push to a three-year high in early January. Normalizing oil prices are certainly a harbiner of better things to come for the energy sector.
The fine folks at Novel Investor provide for us the box charts that follow. We thank them, greatly! The first, immediately below, demonstrates the annual relationship of returns across broad asset categories, both stocks and bonds, in the U.S. and internationally. I like to include this chart when updated as it provides an easy-to-understand visual representation of how the relationships between broad asset categories and markets change over time. The chart also includes a box for an Asset Allocation Portfolio that is broadly diversified, balanced, and fairly indicative of the types of one-size-fits-all portfolios built by other firms for the most typical investor. I have often heard feedback that the level of detail that I provide is nice, but that clients struggle to understand exactly how it should inform their performance expectations. The Asset Allocation Portfolio provided by Novel Investor gives clients an independent, broadly diversified, and balanced benchmark against which to evaluate their own portfolio performance. The Asset Allocation Portfolio described by Novel Investor aligns with Morningstar, Inc.’s Moderate Risk Target Portfolio total return and proves informative for most investors.
Click on the chart to embiggen and activate features.
Right-click to open in a new window. We don’t judge.
 Source: Novel Investor.
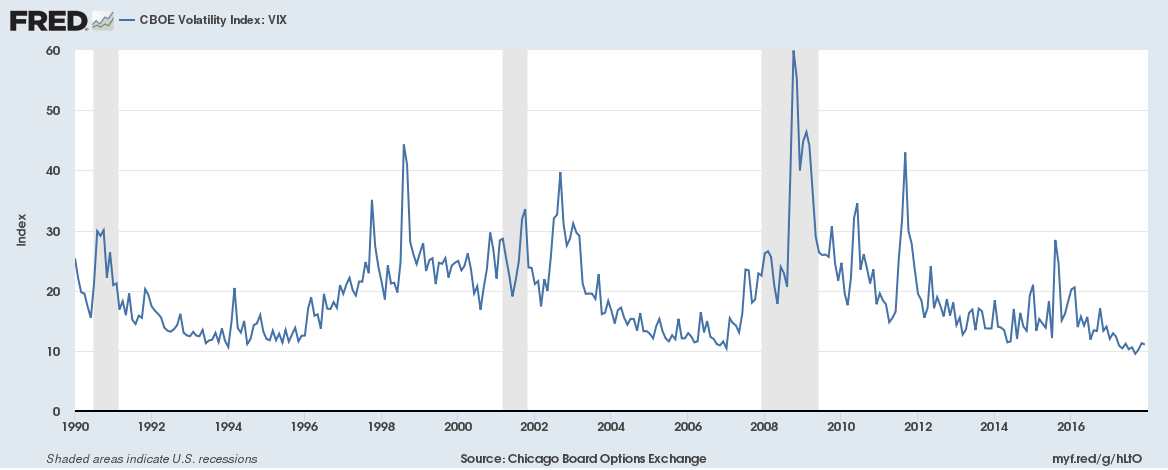
The box chart above illustrates 2017’s positive performance adding to what is the second longest bull market on record, helped by a domestic economic expansion now in the 103rd month (making it the third longest in U.S. history). These strong returns have been amid an environment of historically low volatility as measured by the Chicago Board Options Exchange, Inc.(CBOE) Volatility Index (VIX). And while the length of the current expansion, the length of the current bull market, and so many new market highs may unnerve some investors, it is worth noting that bull markets have not historically ended suddenly at historical highs or simply due to advanced age. Rather, unsustainable policy action, extreme valuations in one or more market sectors, or macro shocks (like geopolitical events) typically bring about the end of bull markets runs and economic expansions. Although market expectations are high, they do not appear to be extreme. Rather than describing market expectations as euphoric or irrationally exuberant describe the current market environment as “amiable”, having or displaying a friendly and pleasant manner.
The Chicago Board Options Exchange, Inc (CBOE) Volatility Index (VIX)
Getting to the specific decisions that influence Lake Jericho client portfolios, let’s briefly cover each of the five levels of our portfolio construction process. And as a brief reminder, no client portfolio will match perfectly typical/target allocation decisions, or sector allocation percentages, as every client experience is unique. These unique factors (such as portfolio start dates, timing of asset transfers, timing of individual contributions or distributions, overall risk profile, etc.) certainly impact exact performance attribution of our strategic and tactical decisions. However, what follows will generally inform you of the nature and direction within your own personal portfolio. Clients should carefully review their individual performance information provided to determine and understand how their particular portfolio is impacted by these decisions and performance versus appropriate benchmarks.
U.S. versus International
On a total return basis the S&P 500 Index gained 6.6% during Q4, 21.8% for all of 2017. The Dow Jones Industrial Average (DJIA) gained 10.9% during Q4, 28.1% YTD. These are among the best quarterly numbers seen in fifteen years. The biggest YTD gains among U.S. diversified funds was among large-company growth-oriented funds thanks to red-hot, mega-cap technology stocks. Technology ended the year as the top performing industry sector. The tech-heavy NASDAQ clearly demonstrates this fact having returned 29.6%.
Improving international economic growth, increasing foreign interest rate expectations, the weaker U.S. dollar, and some uncertainty surrounding U.S. economic policy, drove the outperformance of international equity markets during 2017. The MSCI All-country World Index (a measure of the world’s developed markets performance) finished 2017 higher by 25.6%. If excluding the U.S. from that developed markets index, then the measure of international stocks improves to 27.2%. Even better, the MSCI Emerging Markets Index finished 2017 higher by 37.8%. Our overweights to international investments (with small-company developed market and emerging market overweights imbedded in those investments) served as a meaningful contributor to client portfolio performance during 2017.
Stocks versus Bonds
Interest rates are on the move higher. As long as the move, or the trend in the move, is reasonably paced then the move over time can be deftly managed. Lake Jericho managed portfolios have been defensively positioned against the impact of rising interest rates since 2015, in terms of lower allocations to bonds than is considered typical, in how we constrain allocations to equity investments (real estate, utilities, heavily leveraged sectors) with high negative correlation with interest rates, and in how we position the bond investments that we do hold. We continue to believe that this defensive position is best in the current environment as current bond yields provide little protection from sudden and large adverse price-movements should rates move unexpectedly higher. While certain elements of our defensive position might not add to portfolio returns in many environments, our positioning provides relatively “cheap” risk insurance for a small piece of client portfolios that does not detract meaningfully from portfolio returns in the long run. While our bond positions have been a head-wind for clients during 2017’s outstanding equity market performance, the way in which we construct exposure has been less costly to portfolios than the way in which more traditional managers might implement bond investments. But our lower overall allocation to bonds (and higher allocation to equities) than is typical has been a positive contributions to client portfolio performance during 2017.
Small Versus Big
The small- and mid-sized company space was one that widely outperformed most other sectors immediately after 2016’s election cycle. That the space lagged most other sectors during 2017 is not entirely surprising. However, the persistence of that underperformance post tax reform in the U.S. is somewhat perplexing. Traditional wisdom tells us that tax reform in the U.S. would most benefit small- and mid-sized companies as those companies tend to pay most/all of their corporate earnings tax inside the U.S. (versus large multinationals that are able to shop the world’s most advantageous tax jurisdications). Significant tax savings should fuel significant earnings growth, leading to meaningful outperformance of those company’s stock prices. This has not been the case. We shall see during Q1 2018’s earning season if the weaker U.S. dollar and rising commodity prices are putting a strain on input costs and thereby suppressing earnings.
To fairly evaluate our process regarding the “small versus big” question, we look to the Russell 2500 Index for comparisons. The Russell 2500 Index is a broad measure of blended strategies in both small- and mid-sized U.S. company stocks. For Q4, the Russell 2500 Index returned 5.2% (16.8% for 2017). With the S&P 500 Index return of 6.6% for Q4 (21.8% for 2017), our “small versus big” strategy underperformed large-company peers by 1.4% for Q4 (-5.0% for 2017). And as we do tend to hold larger allocations than is typical in the small- and mid-sized company space, this was a significant drag on client portfolio performance during 2017.
Value versus Growth
U.S. value-oriented equity strategies also wildly outperformed growth-oriented strategies during 2016. As a value-biased portfolio manager, Lake Jericho clients certainly benefited from that differential during 2016. But with the overwhelming outperformance of value-biased strategies during 2016 and of certain elements of value-oriented strategies during Q1 2017, that value strategies began to lag growth-oriented strategies during 2017 is again not surprising. But our focus is on maintaining long-term, strategic positions and not on attempts to time trading patterns. As with small- and mid-sized company exposure, we also believe that investor portfolios should maintain exposure to, if not an ongoing overweight towards, value-oriented investment strategies. The basic premise of value investing is that certain securities are underpriced bargains and are likely to outperform once their “real value” is fully appreciated by investors. If for no other reason, it is a bit of common sense supported by the statistics that if you remain mindful of not overpaying for your investments then you are more likely to achieve superior returns over the long-run. Value-oriented investing is one method that helps investors achieve this objective. A gross over-simplification of an entire field of financial study, but that is the basic idea.
To fairly represent value versus growth factors in the markets we use Morningstar, Inc. measurements. During Q4, U.S. value funds as a group were up 6.3%, right on the heels of the S&P 500 Index return of 6.6%. However, for the full year U.S. value funds as a group were up 14.2%, trailing the S&P 500 Index total return of 21.8% by 7.6%. If we isolate large-company growth strategies within the S&P 500 Index during 2017, return increases to 31.1% and the differential swells to 16.9%. That degree of performance differential, though rare in the long run, surely feels painful in the short-run. But the tide will turn and the relationship will normalize. Luckily (or smartly) our value bias is constructed both domestically and internationally. During most of 2017, international markets simply outperformed U.S. markets. Putting both exposures together, our value bias internationally was essentially a wash for client performance returning a comparable 21.5% to 23.9% depending upon the manner of implementation versus the S&P 500 Index’s 21.8%.
Sector Allocation Decisions
Finally, strategic and tactical sector weighting, the fifth aspect of our portfolio construction process, is an important part of how we add real, long-term value for our clients. Our process of underweighting U.S. equity market-neutral benchmark allocations in favor of overweighting those sectors that we expect to outperform the market average have been a meaningful tailwind for client portfolios over time. If you look at the 2017 column of sector returns in Novel’s box chart below, you will see the S&P 500 Index return for 2017 sitting at #6. The 11 sectors that make up the S&P 500 Index are strewn about, above or below depending upon the sector finish relative to the Index. Our sector overweights are currently materials (#2), financials (#4), and healthcare via medical devices and technology (#5), each besting the S&P 500 Index for 2017. Finishing in second place behind technology was the materials sector at 23.8%. Finishing in fourth place among the 11 sectors was the financials sector at 22.2%. And in fifth place, the healthcare sector finished at 22.1%. Since we were overweight sectors outperforming the S&P 500 Index, and underweight to all of the other sectors underperforming the S&P 500 Index , our underweighting of the high-flying technology sector was muted at bit.
Click on the chart to embiggen and activate features.
If you are not a back arrow person, right-click to open in a new window.
 Source: Novel Investor
Near Term Outlook
Amiable , admittedly, is a strange word to describe a market or to describe the expectations of market participants. But it fits for two reasons widely discussed in the financial media. First, analysts feel that the lingering impact of the global financial crisis caused market expectations during the past decade to be generally so depressed that proper attitudes are only now returning. So, have market expectations been unnecessarily low for so long that our new and proper expectations feel euphoric in contrast? Perhaps say the pundits. I say yes, absolutely. Second, and more tangible than “feelings”, increasing growth expectations are now seen in consensus forward looking estimates for domestic and international real GDP growth, meaning that market participants view global economic growth as supportive of higher equity prices. Further, the consensus among market participants is that room remains for yet more upside. And while domestically the U.S. has had a big run-up in the markets due to the growth impact of tax cuts, markets are continuing to climb higher because those tax cuts are already beginning to show up in household and corporate earnings. In even simpler terms, the economy is growing into these higher stock prices. And that is the historical norm. The stock market has been, and is now, a leading indicator of the health of the underlying economy. This first-mover behavior of equity markets is the market behavior that professional investors expect to see.
So there has to be something, right? Something for us all to fret about, and to wonder if now is the time to sell everything and wait on the sidelines for the reckoning that must come? If you are going to twist my arm and force me to say something unfriendly about this very amiable market then I am going to say that we need to watch the value of the U.S. dollar. The softening U.S. dollar (currently at about a 3-year low) has been a supporting factor for rising commodity prices, a supporting factor for rising international equity returns, and certainly has been a goal of the Trump administration with his focus on the trade deficit. The cheaper the dollar the more we can sell overseas, right? So a weaker dollar has some upside. In past quarter’s we have described our mindful process, carefully watching for imbalances between interest rates, currency values, and commodity prices. In 2015 and early 2016 we talked a lot about what happens when things get too expensive or too cheap. “Too” anything is never a good thing in markets. We might be getting close to a dollar that is “too” cheap. The small-company stocks might be the early warning signal. And if interest rates continue higher without a corresponding increase in the value of the U.S. dollar, then we might actually have a perception problem internationally related to government policy and impacts upon market stability. We shall see. If we do discover a fly in the ointment with respect to this market, it will come through one of the three windows; interest rates, currency values, or commodity prices.
We remain watchful and ready to respond should we see signs on the horizon of something awry. I encourage you once again to take a bit of time and enjoy what this market is providing. There will be time for worry later. As always, I am available at any time, any day of the week, to discuss specific portfolio performance questions. I will also be in touch with each of you in the coming weeks as Lake Jericho rolls out its new collaborative and interactive financial planning application. Until then, be well, enjoy the rest of your week, and thank you!
A.J. Walker, CFA CFP® CIMA®
Founder, President, and CEO
Lake Jericho, LLC