2nd Quarter 2016: Quarterly Recap and Near-term Outlook

The thing about crafting a useful investment review at each quarter’s end? I’ve been writing such reviews for more than 20 years and at times I struggle for days (if not a week or so) trying to decide what it is that I most need to communicate. This quarter-end has been one of those times. Often an appropriate review does require one to artfully connect many of the complexities and nuances of the markets. Most times, however, the appropriate review focuses on a short and direct message. Fortunately, even though I have to go through the struggle, I eventually remember that I overcomplicate things just when the message need be most simple. My short and direct message for this quarter? All things considered, we all did pretty well.

When we step back and consider all the crises, both manufactured and real, of the past couple of years (from Grexit to Brexit, from the long trudge out of the depths of the U.S financial crises to current deceleration of growth in major world economies, from fears of rising nominal interest rates domestically to actual real negative interest rates abroad, and let’s not even start on the most bizarre election cycles across developed markets in memory) we are benefitting from U.S. markets that seem to defy gravity’s full effect no matter the headlines. The U.S. economy appears in good shape overall following the slowdown in the first quarter (and the 11% decline in markets) that resulted largely from reduced corporate earnings during 2015. First quarter GDP growth was revised upward in May and continues to exceed inflation measures. Consumer spending (the main engine of the U.S. economy) continues to expand. Manufacturing reports indicate expansion, although still suggest soft growth in the sector. Real estate (including construction and construction spending) continues its upward trajectory. Job opportunities continue to grow (although a bit weaker mid-quarter) with the unemployment rate in the U.S. falling to 4.7%. Despite a few setbacks and a bit of volatility U.S. stocks were nicely positive for the second quarter, a welcome continuation of the rally from the mid-February lows.

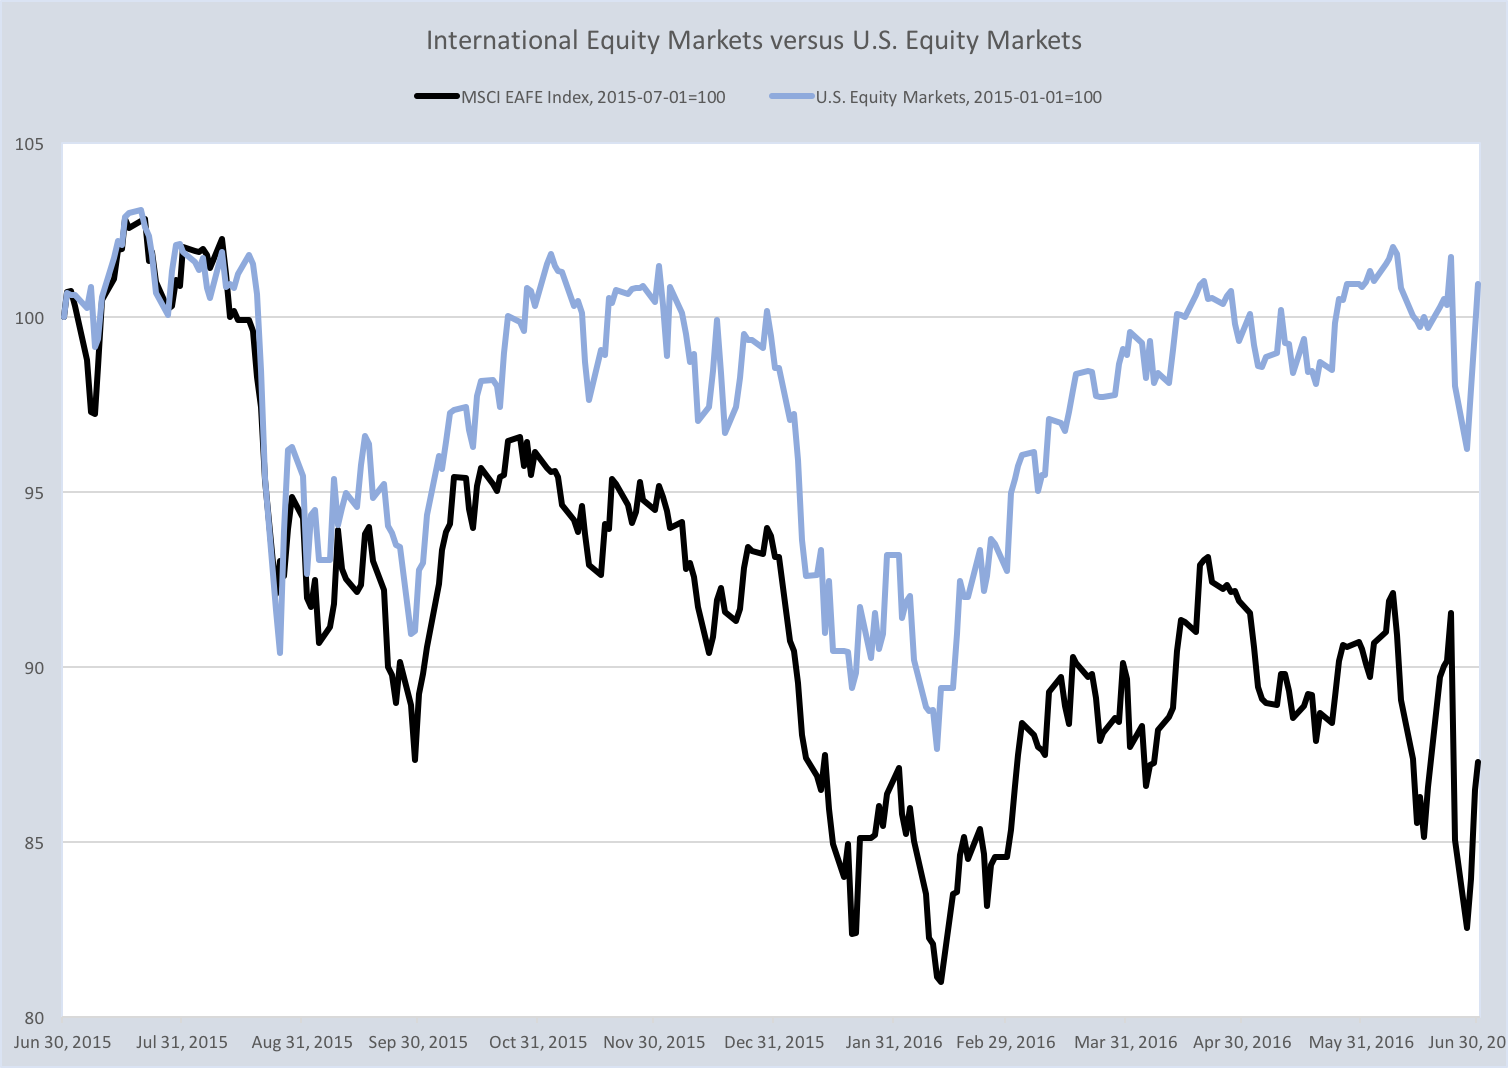
Yes, on June 23rd voters in the U.K. elected to leave the European Union, to the surprise of basically everyone. Global markets reacted wildly with big drops in stocks the following two trading days. U.S. stock markets recovered strongly the next two trading days after that, making up much of the decline. Most major U.S. broad market indices now sit, post quarter-end, comfortably at new all-time highs. Foreign developed markets, and particularly the E.U. markets, have not yet fully recovered but have moved solidly higher. The chart below illustrates the difference between large- and mid-sized U.S. stocks (the MSCI USA Index of large- and mid-sized companies represented by the blue line) versus international stocks (the MSCI EAFE Index represented by the black line). The MSCI EAFE Index represents the performance of large- and mid-sized securities across 21 developed markets, including countries in Europe, Australasia and the Far East, but excludes the U.S. and Canada. The chart makes clear the impact of continued challenges in overseas markets from the Grexit fears of mid-2015, through the global growth fears related to China surrounding the 2016 new year, and to the latest impact of the Brexit vote. Versus the resiliency of the U.S. market, the past year in international markets was disappointing at a negative 12.7%, with a year-to-date return at June 30 for the EAFE Index of -6.3%. A continued rally since the end of the second quarter has cut the year-to-date loss to -3.9%, although effects from weaker foreign currencies continue to drag on a full price recovery.

International Equity versus U.S. Equity

Lake Jericho’s long-term portfolio construction process involves five distinct levels of strategic decision making. The first level in our process is the global allocation decision; how much of a portfolio should be invested in international markets versus invested in the U.S. market. Our long-term outlook for growth rates in international markets exceed that of our long-term outlook for U.S. growth. The higher growth expectation is why we invest significant assets in international markets. While our allocations are less than a global market-neutral allocation, they are higher than the typical U.S. based investment advisor. No doubt that the past year has been challenging as a result. However, bad times, as with good, don’t last forever. As the table below illustrates, one year’s laggard is often among the next year’s leaders. Mean-reversion is real and is why we remain committed to our total international allocation level within portfolios. These global investment decisions then inform asset allocation decisions amongst stocks, bonds, and alternative asset classes within U.S. or international markets (the second level of the strategic decision making process). If we make any changes during the second half of 2016, it would be to reallocate the geographic distribution of the international holdings rather than any reduction of the total international allocation.

Novel Investor Asset Class Returns TableSource: NovelInvestor.com

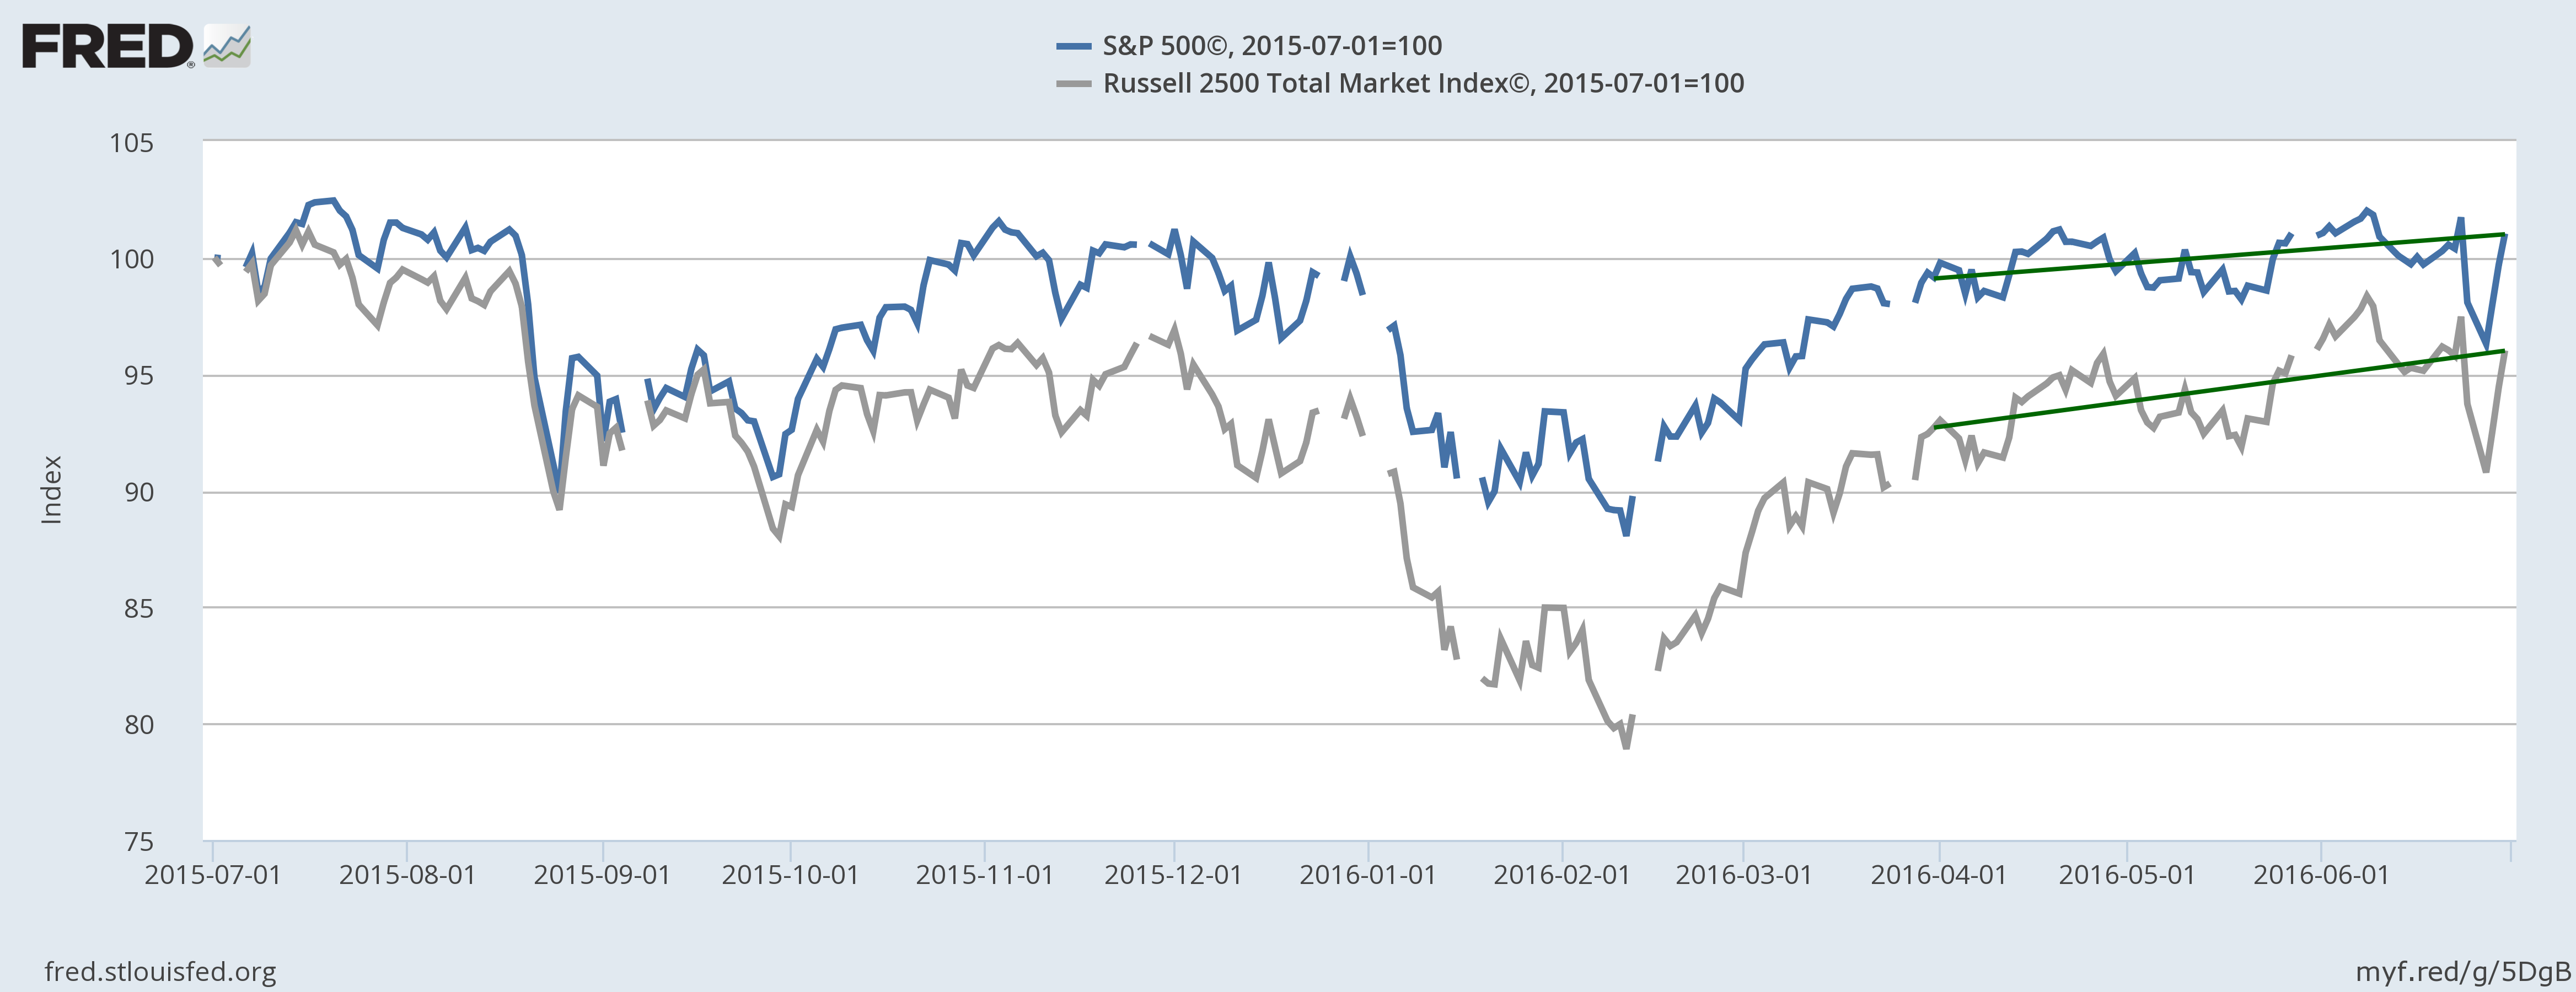
The S&P 500 Index returned 2.5% for the 2nd quarter, resulting in a year-to-date return through June 30 of 3.8%. Small- and mid-sized company stocks (represented by the Russell 2500 Index) fared even better with quarterly gains of 3.6% (for a year-to-date through June 30 return of 4.0%). Certainly, being invested in U.S. equities (particularly in large U.S. companies) has been most advantageous during the past year. The chart below compares the S&P 500 Index and the Russell 2500 for the past year. I draw your attention to two things; the outperformance of large companies versus smaller companies through the early months of 2016, and then to the reversal of that performance difference between during the last four months. You will see (by the slope of the two green lines) that during the second quarter small- and mid-sized companies narrowed that performance gap. These “size” decisions are another among the five levels of our portfolio construction process. Investment performance during the quarter was helped by our typical overweighting of small- and mid-sized companies versus a U.S. equity market-neutral portfolio.

Large Company Stocks versus Mid- and Small-Company Stocks

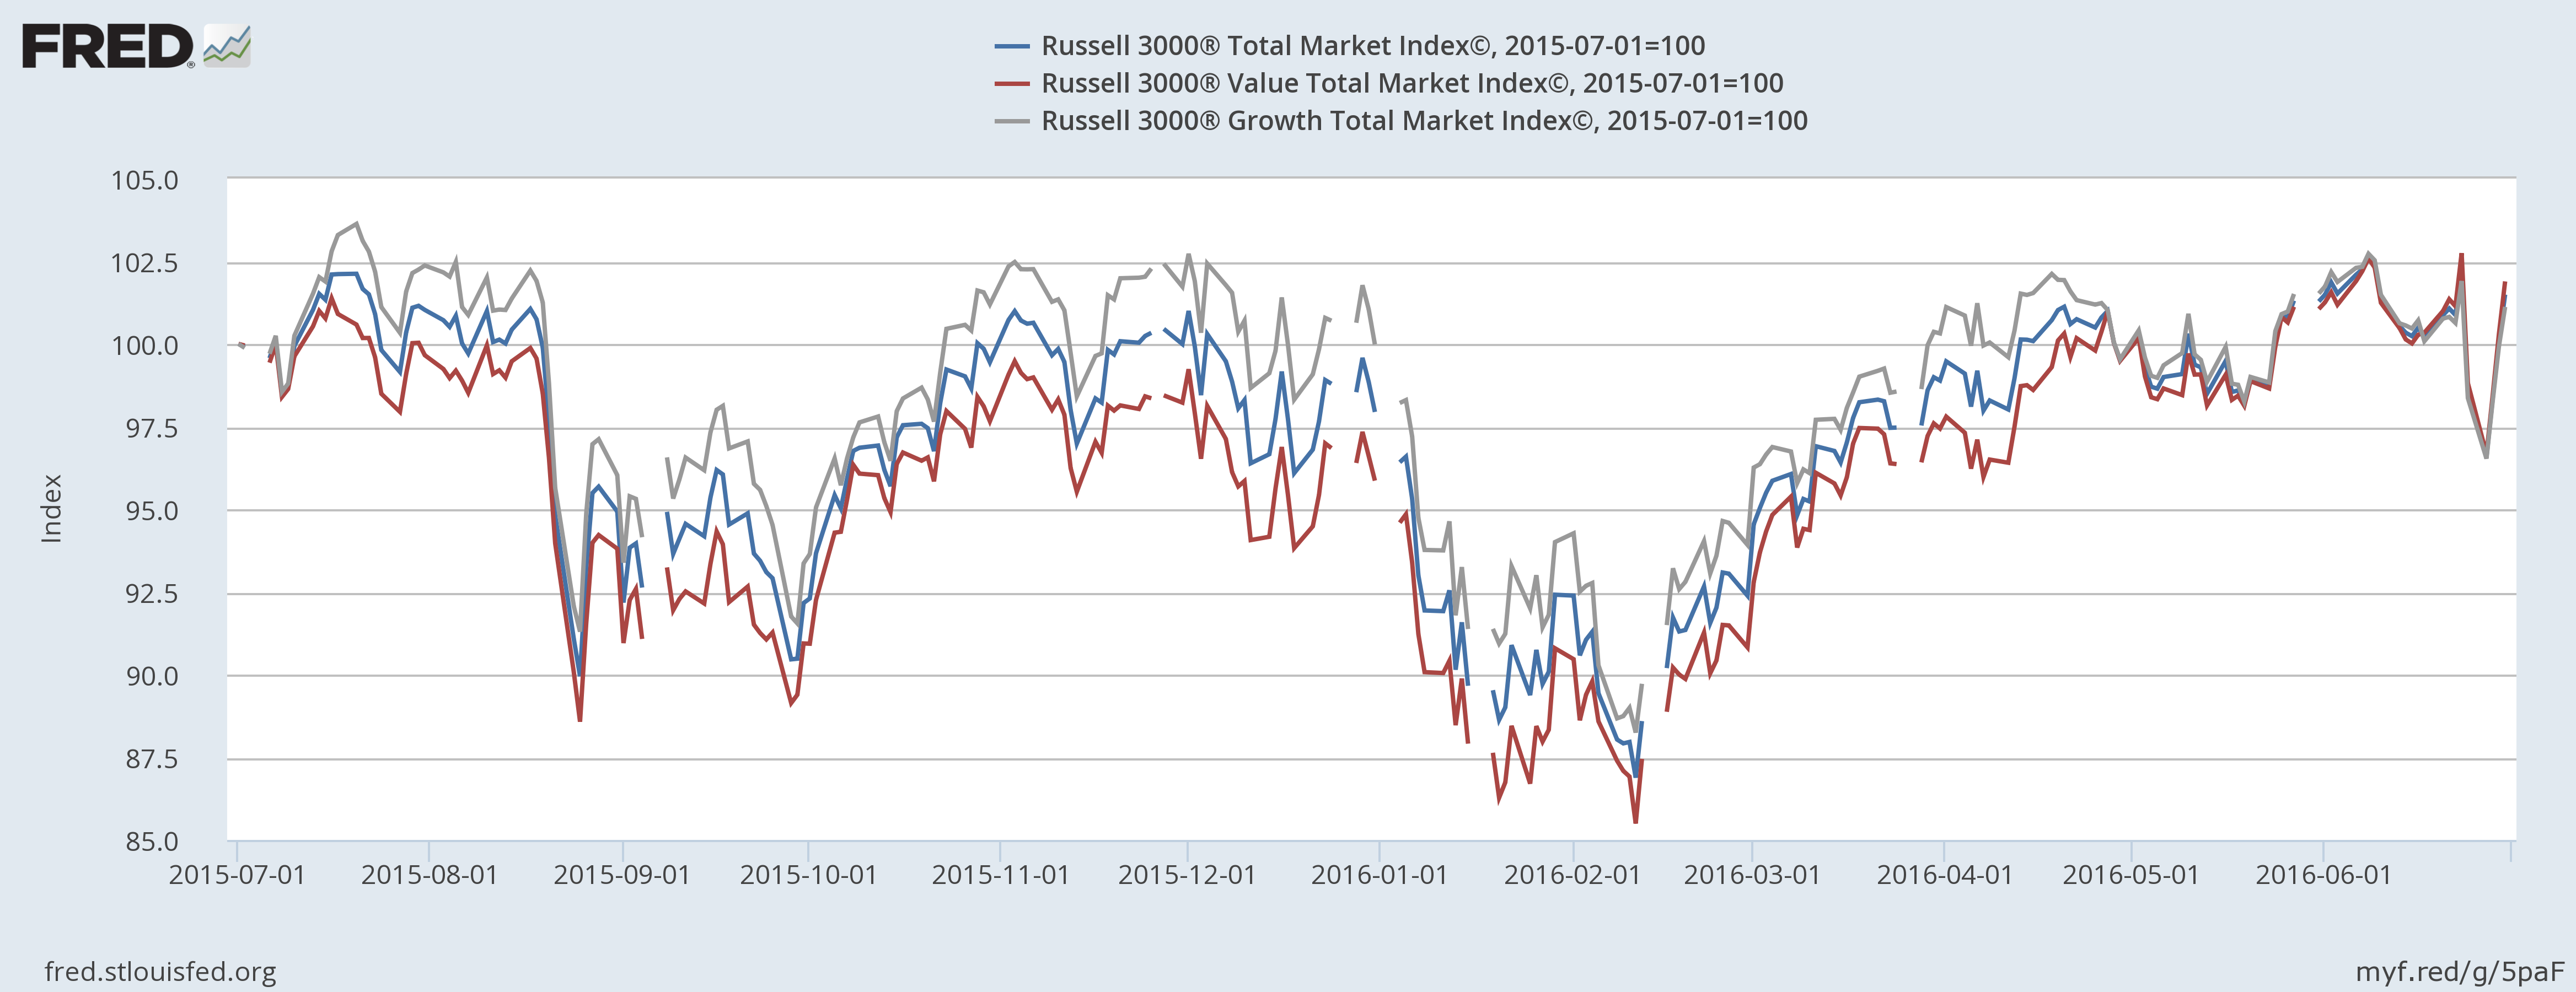
Company valuation metrics are another distinct level of our long-term decision making process. Company valuation categorization is a combination of quantitative measurements and qualitative art, referring to companies as value-oriented, growth-oriented, or core. In layperson’s terms, it boils down to “how expensive is the stock versus its earnings expectations”. Although Lake Jericho portfolios most often represent elements of each category, our long-term bias tilts towards value-oriented investments. Some refer to our style as “growth at a reasonable price”, a fair label as far as labels go. When examining the next chart one will see that value-oriented investment strategies (the red line) have underperformed both growth-oriented (the silver line) and core investments (the blue line) during 2015 and early 2016. This pattern reversed late during the first quarter and value strategies outperformed through the second quarter. Value-oriented strategies, which we do overweight versus a global market-neutral portfolio, now slightly lead both growth- and core-oriented strategies for the last year and have contributed positively to portfolio performance.

Value-Oriented Strategy

Bonds prices increased as interest rates fell for another quarter (interest rates and bond prices move in opposite directions). Over the last three months the Barclays Aggregate Bond Index (a broad measure of bond-market performance) was up 2.3%, 5.1% year-to-date, and is up 5.40% for the last year through June 30. We have maintained a more conservative position for clients than that represented by the Aggregate Index. Our bond positions remain invested at about a 2.7 year duration versus the Aggregate Index duration of about 5.5 years duration. The best way to think about duration and how it represents risk to bond investment performance is that should interest rates rise, a 2.7 year duration investment will be negatively affected by less than half of what the 5.5-year duration investment would be affected. The lower duration investments will not fall in price as dramatically as a longer duration investment when interest rates increase. With interest rates at historical lows, we feel that there is much more risk of interest rates rising in the U.S. than of rates continuing to fall. However, when interest rates fall the price of a short duration investment will not rise as dramatically as a longer duration investment. That is the trade off, and that is why our holdings returned about 1.5% for the 2nd quarter, 3.2% for the year-to-date, and about 3.8% for the year ending June 30.

By sending interest rates lower, the bond market could be anticipating economic weakness or simply conceding that the U.S. Federal Reserve will be challenged to increase rates in the face of rising global uncertainty, regardless of the state of the U.S. economy. Either way, ever lower bond yields bolster a continuing argument that increasing stock prices are now the result of a lack of viable return alternatives to stocks, known as TINA (“There Is No Alternative”). The TINA argument acknowledges that the S&P 500 Index dividend yield has hovered around 2% for about 10 years while the yields on U.S. Treasury notes have steadily declined. The chart below illustrates the movement in U.S. Treasury bonds over time versus the rather steady nature (green line) of average stock dividend yields. Many large U.S. company stocks now provide dividend yields in excess of the yield on their own 10-year corporate bonds, and certainly above 10-year Treasury bond yields. Granted, the principal risk is higher for stocks, but the trade-off is perceived as manageable for long-term investors. For these reasons, it is easy to understand why some argue that stock prices are being pushed higher simply by those seeking a steady income stream jumping into stocks from bonds. Bonds, with prices that move inversely to interest rates, have been moving ever higher as well and now look incredibly expensive by comparison to stocks. At Lake Jericho, our view is a bit more tempered. We believe both the lofty stock and bond prices in the U.S. are more of a function of the “flight to quality” that investors undertake during times of heightened uncertainty and less to do with stretching for yield. Patience, ever our watchword, reminds us that normalcy always returns. As such, we feel that we are best positioned by maintaining modest bond exposures in our client portfolios and that those modest exposures themselves are quite conservatively invested. If (or when) interest rates do turn higher, we are well positioned.

Treasury Yields versus Dividend Yield

Finally, tactical sector weighting is a fundamental element (the fifth level of decision making) of what we do and how we add value over time. Few portfolios will match all sector allocations, or sector allocation percentages exactly, or the timing of investments perfectly, and these factors certainly impact exact contribution to performance of our sector “bets”. However, our process of underweighting U.S. equity market-neutral benchmark allocations in favor of overweighting higher expected growth sectors (materials, medical devices and instruments, and pharmaceuticals) added about 0.40% in excess return to the typical client portfolio during the second quarter. Two sectors plays that have not performed as expected are our overweights to the consumer discretionary sector and our overweights in certain large and less risk-adverse portfolios to the genomics/biotechnology sector. While the consumer space has remained strong during this year’s volatility, that strength has not translated well into an increase in broad discretionary spending. While there are some signs of life beginning to emerge, discretionary spending has expanded much slower than we anticipated heading into 2016. The genomics/biotechnology sector has been hamstrung to a great extent by political rhetoric in the primary cycle. In fairness, there has been some concern about the pipelines for approval of new therapies but that shadow is beginning to fade and there now seems to be more merger and acquisition discussion in the space. We remain confident of a turn-around in the coming year. These two sectors served to reduce performance by about 0.20% during the second quarter.

So what does all of this mean for us going into the second half of 2016? More than 100 years ago American Financier and Banker J.P. Morgan said “No problem can be solved until it is reduced to some simple form. The changing of a vague difficulty into a specific, concrete form is a very essential element in thinking.” I think J.P. Morgan himself would agree that the essential element we need examine is global political stability and economic growth. I fear J.P. Morgan himself would agree that we have a deeper difficulty at the moment in our ability to examine global growth appropriately as we are faced with a unique challenge presently; increased ease and efficiency at doing the quantitative analysis required of us, but increased complexity and difficulty in the qualitative elements that influence our results. We have before us the statistical evidence supporting a forecast for broad expansion in the U.S. and international markets. We also have before us a great deal of political and social uncertainty, that which is impossible to quantify, that can undo all of the hard evidence and leave us flat for an extended period of time. Lake Jericho’s process is designed to capitalize most upon this latter prospect. While we fully expect to capture a great percentage of upside in rising markets, we are most adept at limiting downside risks during volatile times and through our tactical sector strategies capture value where ever it presents itself when opportunities are scarce. We are going to stay the course at least through the end of the third quarter. At that time we will re-evaluate the quantitative evidence before us and temper our outlook with the atmosphere (qualitative) that develops in advance of the U.S. elections. And of course, we will be continuously watching movements in the U.K., the E.U., and developments in Asia and the impacts upon client portfolios.

We are available at any time, any day of the week, to discuss specific portfolio and performance questions. Until then, be well and enjoy the rest of your weekend!

A.J. Walker CFP® CIMA®
Founder and Senior Consultant
Lake Jericho, LLC

4th Quarter 2015: Quarterly Recap and Near-Term Outlook

The thing about crafting a useful investment review at each quarter’s end? As each quarter-end approaches I spend a lot of time thinking about the messages most important to reinforce with clients. Then without fail, within days after each quarter-end any manner of hell will break loose that deserves equal coverage. The 4th quarter of 2015 and the 1st week of 2016 are no exception.

The single, most striking theme during 2015 was that although the U.S. economy continued its pattern of economic recovery, not much in the investment arena worked really well. Although the S&P 500 Index (basically the largest 500 U.S. companies) managed to eek out a modest positive return (1.36%) thanks to stellar returns of a few companies, most asset classes ended the year in negative territory with highly positive correlations. This lock-step movement of asset classes provided few safe havens for investors during 2015. It was a year that reminded us that when we talk about a strategy, or a tactic, that works to our benefit “over time” that it does not mean that it will work to our benefit every year.

S&P 2015 Total Return
S&P 500 Index: 2015

A year like 2015 is why we remain committed to a long-term course of action for client portfolios. Every quarter we remind clients that Lake Jericho is an investment firm and not a trading firm, and as such we remain invested in our decisions rather than playing the game of speculation and short-term trading.

As for the past week, I am reasonably certain that by now everyone is aware of the dumpster-fire that was the first week of 2016. The multitude of various sector and style indices aside, the first trading week of 2016 goes into the history books as the worst opening of a new year’s stock market. In the coming years it will no doubt be the subject of much review and ivory-tower analysis. The factors driving the past week are many and complex, but are simply a continuation of the challenges endured throughout most of 2015. Therefore, I choose to roll it all up into the following discussion. I am going to break down just a few of the most important elements that have had the greatest impact on Lake Jericho client portfolios. I will also briefly talk about how these factors impact our strategy for 2016.

  • Math.

Last quarter I used a few hundred words to describe how we look at the value of a thing (what an investment is worth to us) versus the market price of that thing (what that investment is worth to someone else). If an investment is of more value to us than the price the market is offering to purchase that investment, then we hold that investment until the market price and our value converge. Many circumstances can cause our value of holding any investment to change over time. But why does the market price of investments change all the time? Simply stated; math. It is a cheeky response, but true.

The market price of an investment is nothing more than a momentary consensus of willing buyers and willing sellers estimation of the future value of a company’s expected cash flows. We take some rate of growth, grow that exponentially over some period of time, multiply that by expected cash flows. Easy breezy. Even if you hate math you know that when you exponentially grow some number that the result grows really quickly. You also know that if you make little changes in numbers grown exponentially (grow 2 by 3 and you get 8, but grow 3 by 3 you get 27, grow 4 by 3 you get 64) your result increases dramatically. Small changes, over time, have big results.

Very simply, this is what is happening with stock prices and why they have been moving so much. Small changes in a company’s earnings, or small changes in growth rates, over time, result in large (exponential) changes in stock price. Some more math (known as discounting) happens in the middle of that, but you get the idea. This idea is fundamental to understanding what is happening in the stock market these days.

Last quarter I suggested that uncertainty is worse for stock markets than certain, but bad news. Uncertainty is driving this market volatility. In the investment arena, there exists a razor-thin line between something being too expensive, and that thing being too cheap. Markets are in perpetual motion trying to maintain equilibrium on the edge of that razor attempting to discern what, based upon corporate earnings and growth rates, is too expensive and what is too cheap.

  • The U.S. Dollar.

The U.S. Dollar (in relation to other currencies) is an example of something that has become too expensive. One example of the effect is pretty easy to see at work. The second example is more complex. Unless you are an accountant or analyst it is one you likely never think about.

First, a strong dollar is good for U.S. consumers (we can buy more stuff from other countries), but not so good for U.S. businesses (they can not sell as much of their stuff to other countries). So while the consumer-based parts of the U.S. economy are doing well, U.S. businesses that do a large percentage of their business abroad are not doing so well. U.S. companies are earning less internationally.

Second, when a U.S. business generates earnings in foreign markets, those earnings have to be converted back into U.S. dollars for financial reporting and tax purposes. When the value of the U.S. dollar is high relative to foreign currencies, those foreign earnings, simply by exchanging them back into U.S. dollars, are suddenly not worth nearly as much. U.S. companies, already struggling to maintain sales/income in international markets (because their goods and services are now more expensive) are hit with a double-whammy. The earnings that they fought to achieve are simply worth less because of exchange rates.

Both of these examples illuminate the math discussion above; how big changes in corporate earnings (in this example due to the strength of the U.S. dollar) occur in unanticipated ways and how those changes in earnings impact stock prices.

U.S Dollar Index
Strength of U.S. Dollar to Major Currencies: 2015
  • Stuff that goes into other stuff.

Americans have bemoaned the high cost of gasoline and our lack of energy independence for the last 15 years. The country almost elected a different President because some thought it cost too much to fill up their truck. We have been punching holes in the ground and pumping in fluids to extract so much oil that the U.S. is now an exporter of the stuff. And for the last 25 years the world’s largest mining companies were digging big holes, with big machines, to get tiny, important, rare, expensive stuff out of the ground to help fuel our demand for smaller, faster, cheaper stuff.

Gas is now cheap. Every house has something like 10 bagrillion-inch flat screens TV’s. We all get new phones, tablets, or laptops with every refresh cycle. We love this part of the global slowdown! But if this is so good, then why does it look so bad? It looks bad because there is cheap, and then there is too cheap.

Oil, commodities, and other factors of production have now become too cheap. As a leading indicator of global growth rates, falling prices in the factors of production is interpreted as purely a reflection of demand and therefore a harbinger of slowing global growth. One tangible example of a direct effect is pretty easy to see at work in our daily lives. But when we extend this effect into the markets? The result is more complex, and unless you are an accountant or analyst you do not think about it much.

Materials Index 2015
Industrial Materials Index: 10-Year Price Level

First, cheap oil and low commodity prices are GREAT for the average U.S. consumer. The money we save due to cheaper energy and lower priced good means that we can save more or buy more. Saving more or buying more must be a good thing, right? In the long run, perhaps. But it takes a long time (and usually a lot of economic pain) to get to a new normal based upon changes in consumption and savings habits. Again, it is about markets in constant motion trying to maintain equilibrium on the edge of the razor.

While cheaper energy and commodities might be good for the average American consumer, the cyclical (business cycle change) or secular (a permanent change) friction upon energy companies (upstream or downstream), mining companies, heavy equipment manufacturers, transportation (railroads, shipping, trucking) companies, has been devastating to earnings. Having made significant investments in capacity for the past couple of decades using assumptions of much higher prices, these companies now have excess capacity and overhead that they can not support. Many companies are being forced to slash production, lay off workers, shutter wells, close mines, and even seek bankruptcy.

In these industries, you are not simply seeing a reduction in the rate of growth. Rather, you are seeing negative growth rates. Negative growth is just an economist’s way of saying “shrinking”. Again with the math, but when you have exponential negative growth, earnings quickly disappear. In short order, debt overwhelms these companies and the assets are forced into liquidation.

Many companies in these industries are small- and mid-sized companies. The energy, commodities, and materials sectors are a big part of the reason that the small-cap and mid-cap sector indexes (represented below by the Russell 2500 Index) have significantly underperformed big-company stocks during 2015.

Russell 2500 Index: Small- and Mid-Cap Performance

Lake Jericho overweights both small- and mid-sized companies in our portfolios. This adds the potential for more price volatility in our portfolios. However, the potential for additional return afforded by this overweighting more than compensates long-term investors for the additional risk. Only during a few, short-term, investment horizons, have small- and mid-sized company investments under-performed large-company only portfolios. 2015 happened to be one of those years. We maintained these overweights throughout 2015 and will continue to do so during 2016.

We did move to purposefully underweight the energy sector in our asset selection throughout the year. However, it is nearly impossible to completely shield a portfolio from the influences as energy permeates every part of our economy.  Towards year-end 2015 and into 2016 we have chosen to add additional weight to the materials sector of the U.S. economy as we believe this category should benefit from lower factor costs and recover quickly following recent underperformance. We believe the material sector is likely to be a leading indicator of a larger global turnaround later during 2016.

  • New kids on the block.

Our discussion of U.S. Dollar strength and the cost of stuff both feed into the corporate earnings part of our math discussion. What follows is a discussion about the growth part of the discussion.

Developed economies don’t manufacture stuff. Developed economies own stuff, consume stuff, and get served stuff. Emerging economies manufacture stuff in the hopes of earning enough money to also just own, consume, and get served stuff. Frontier economies get plundered for resources but that is another story for another time.

We need not rehash the transformation of the U.S. from a manufacturing economy into a consumer/service-based economy. For a long time, the saying was “as goes the U.S.A., so goes the world” when referring to the engines of economic growth. And we need not rehash the transformation of the Chinese economy from a largely rural and agrarian society into the world’s fastest growing manufacturing economy. That growth transformed China into the world’s second largest economy by 2003. Indeed, that saying can arguably be expanded to “and also as goes China, so goes the world”.

In working with clients, we have spent much of the past three years cautioning others to be mindful of exposure to emerging markets and the Chinese economy. From its founding, Lake Jericho has been thoughtful and purposeful with exposures to emerging markets generally, and China specifically. Emerging market exposure is an important part of a portfolio’s long-term asset allocation. However, we knew that the lofty rates of growth, specifically in China, could not be maintained sustained.

As 2015 progressed we took several steps to either underweight emerging market and China exposures in our portfolios, or have the exposure actively managed by another top-tier firm. We were keenly aware of the tie between European developed markets and China, yet we underestimated the degree to which the Chinese and the U.S. economies are inextricably weaved. Our overweighting of international markets and the inherent exposure to emerging markets, inclusive of China, adversely affected our investment performance for clients during 2015.

China has, rightfully or wrongly, become the idiomatic “Canary in the Coalmine” for global growth. Manufacturing growth? Maybe. But I have a problem with China being the proxy for all global growth. Nonetheless, during the past year manufacturing output data from China has been weakening and investors have interpreted that to mean that economies around the globe must be slowing. Falling energy and commodities prices also were used to foretell of China’s slowing economy.

In my estimation, there is a bit of “cart before the horse” going on. I think that the markets have reacted too strongly to suspect data from the Chinese markets. While it is true that China is slowing, other emerging manufacturing economies are experiencing higher rates of growth (India, Malaysia, Indonesia, Nigeria, Ethiopia, etc.) and are simply producing more stuff now. Only time and more data (which China releases with a great lag) will tell the full story of the secular or cyclical frictions within these evolving economies. Regardless, the result is the current oversold conditions in the markets and the negative impact upon our client portfolios 2015.

  • Raising interest rates does not always increase interest rates.

One final thing to touch upon briefly, as it did guide allocation decisions heavily this year, is the non-action of the U.S. Fed for most of the year regarding the normalization of interest rates. With certainty I predicted that the Fed would begin raising rates in the summer of 2015, leading to underperformance of the bond markets versus stocks. When interest rates increase, the prices of bonds fall. At high rates of interest, the price movement does not represent much of the total return from bonds. But in the current environment of low rates, small increases in yield could have a dramatic impact upon the price return of a bond portfolio. This is the reason for our cautious allocation to bonds for most portfolios. And for those portfolios for which we are holding meaningful allocations, we are doing so at very short maturities.

While I stand by my belief that the Fed could have acted in June, they did not do so until December. The chart below demonstrates the yield of the 2-year Treasury Notes (our average maturity for clients) throughout 2015. You will notice that well in advance of the Fed’s move, rates began to climb. As well, you will see (as the chart extends through the first week of 2016) that changes of the Fed’s target rates might not have a long-lasting effect. Yields had already started to fall once again due to a “flight to safety” by many market participants during the past week’s volatility.

2-Year CMT: January 1, 2015-January 8, 2016

Although the returns provided by bonds during 2015 were nothing to cheer about (and in real terms were actually negative when accounting for inflation), bond allocations did protect investors from some degree of the stock market’s move lower. When compared to many advisors, Lake Jericho does maintain lower allocations to traditional bonds and this did adversely affect portfolio performance during 2015. Our underweighting of traditional bonds will continue into 2016. Our continued analysis maintains that an overweighting to equities in the current interest rate environment is the best approach to meet long-term investment objectives for clients.

Trust that we are keeping our eyes on all of the moving pieces across the globe and across the markets. While 2015 did not favor many of our portfolio biases, we remain committed to our strategy for the long haul. The year has just begun. And while January is a fair statistical indicator of the markets direction for the coming year, we will sit tight for the near term. As significant events unfold you can be certain that we will provide updates as needed and advance notice of any deviations in portfolio strategy should market forces warrant them.

Each of you can expect to receive your account-specific quarterly statements in the coming days. We are available at any time and any day to discuss specific portfolio performance. Until then, be well and enjoy the final few hours of your weekend!

A.J. Walker CFP® CIMA®
Founder and Senior Consultant
Lake Jericho, LLC