The thing about crafting a useful investment review at each quarter’s end? It is often the case that one will need to construct a coherent discussion of what were actually two (or more) very different markets. The 1st quarter of 2016 is a tale of two halves.
2015’s volatility continued into the 1st quarter of 2016 amid much fretting about a possible U.S. recession, a lack of global growth, and the collapse of oil and commodity prices. U.S. markets were as close to an actual bear market not seen since the depths of the 2008 financial crisis. The bears had a lot of ammunition to make their case. Weak economic data at home fueled speculation that the U.S. economic expansion was coming to an end. Chinese stocks were crashing and many feared Beijing’s debt-fueled economy would follow suit. The prices of oil and commodities were in free fall. Bank stocks were tanking from fears of potential defaults within their energy loan portfolios. The U.S. dollar continued to climb as global demand for U.S. denominated assets reached a new peak, delivering a hit to earnings of U.S. multinationals. Global markets turned turbulent and wildly volatile. The Bank of Japan pushed borrowing costs into negative territory for the first time. Adding to market fears, most on Wall Street feared the Federal Reserve would soon make a second hike of short-term interest rates, and was likely to make too many hikes in 2016.
The S&P 500 (a measure of the largest 500 U.S. companies) opened 2016 by falling 1.5% on the first trading day of the year. At the end of the first week of the year the S&P 500 was down 6.0%. And though the market bounced about the following weeks, the S&P 500 would find its bottom on February 11th with a 10% total decline for the quarter. Other sectors of the market would fare far worse. The Russell 2500 Index (a measure of small- and mid-cap U.S. company stock performance) was down 14.0% at the February 11th bottom. International equity markets, generally expected to provide some measure of diversification and shelter from U.S. market volatility, were also down sharply. As measured by the FTSE Ex-US Index (a comprehensive measure of non-U.S. publicly traded companies), international stocks were down about 11.0% at the February 11th bottom. At the peak of pessimism on February 11th the Dow Jones industrial average closed nearly 15.0% below its May, 2015 record high.
After hitting the panic button in the first half of the quarter, investors regained some composure mid-February. One by one, the fears and obstacles that had put the U.S. stock market on the brink of its first bear market in 7 years began to dissipate. In a sharp reversal of outlook, markets shrugged off global concerns and rallied aggressively through quarter-end. The S&P 500 finished +1.35% for the 1st quarter. The small- and mid-cap company Russell 2500 Index finished +0.3% for the 1st quarter. International equities as measured by the FTSE Ex-US Index finished the quarter lower by about 0.6%. Emerging market equities outpaced developed markets by about 2.3% finishing in positive territory for the 1st quarter.

Early during the first quarter any type of reversal seemed unlikely. So what happened? Arguably, the market simply was oversold and due a big bounce. While true, a bounce has to be kicked-off by some thing, or some group of things. This bounce got its kick largely from a recovery in energy and commodities prices, from a few bits of improved macroeconomic data, a steady hand by central banks both in the U.S. and abroad, and a weakening U.S. dollar.
- Energy and Commodity Prices.
Without question, the most influential market variable in the past 15 months has been oil and commodity prices. While cheaper energy and lower commodity prices are good for the typical consumer in the long run, there exists a delay in the short run translation of those consumer benefits into meaningful economic impact. In the interim, the cyclical (business cycle change) and secular (permanent change) impact upon energy related companies (upstream or downstream), mining companies, heavy equipment manufacturers, transportation (railroads, shipping, trucking) companies, has been devastating to earnings. When earnings drop, stock prices drop. It was no surprise that continued weakness in oil and commodities during the 1st quarter translated directly to weakness in the stock market. And equally without surprise, was the turn higher in stock prices coincident with the turn in energy and commodity prices.

It is no coincidence that on the same day stocks bottomed that U.S.-produced oil (WTI) hit a 13-year low of $26.21 a barrel. When oil, which was down nearly 30% in 2016 and 80% from its high, stabilized, that lifted pressure off of energy and energy-related firms struggling to meet their operating income needs and to make debt related payments on time. Rising oil prices also relieved pressure in credit markets tied to the oil/energy complex. In reality, this was the turning point that sparked the market’s recovery.
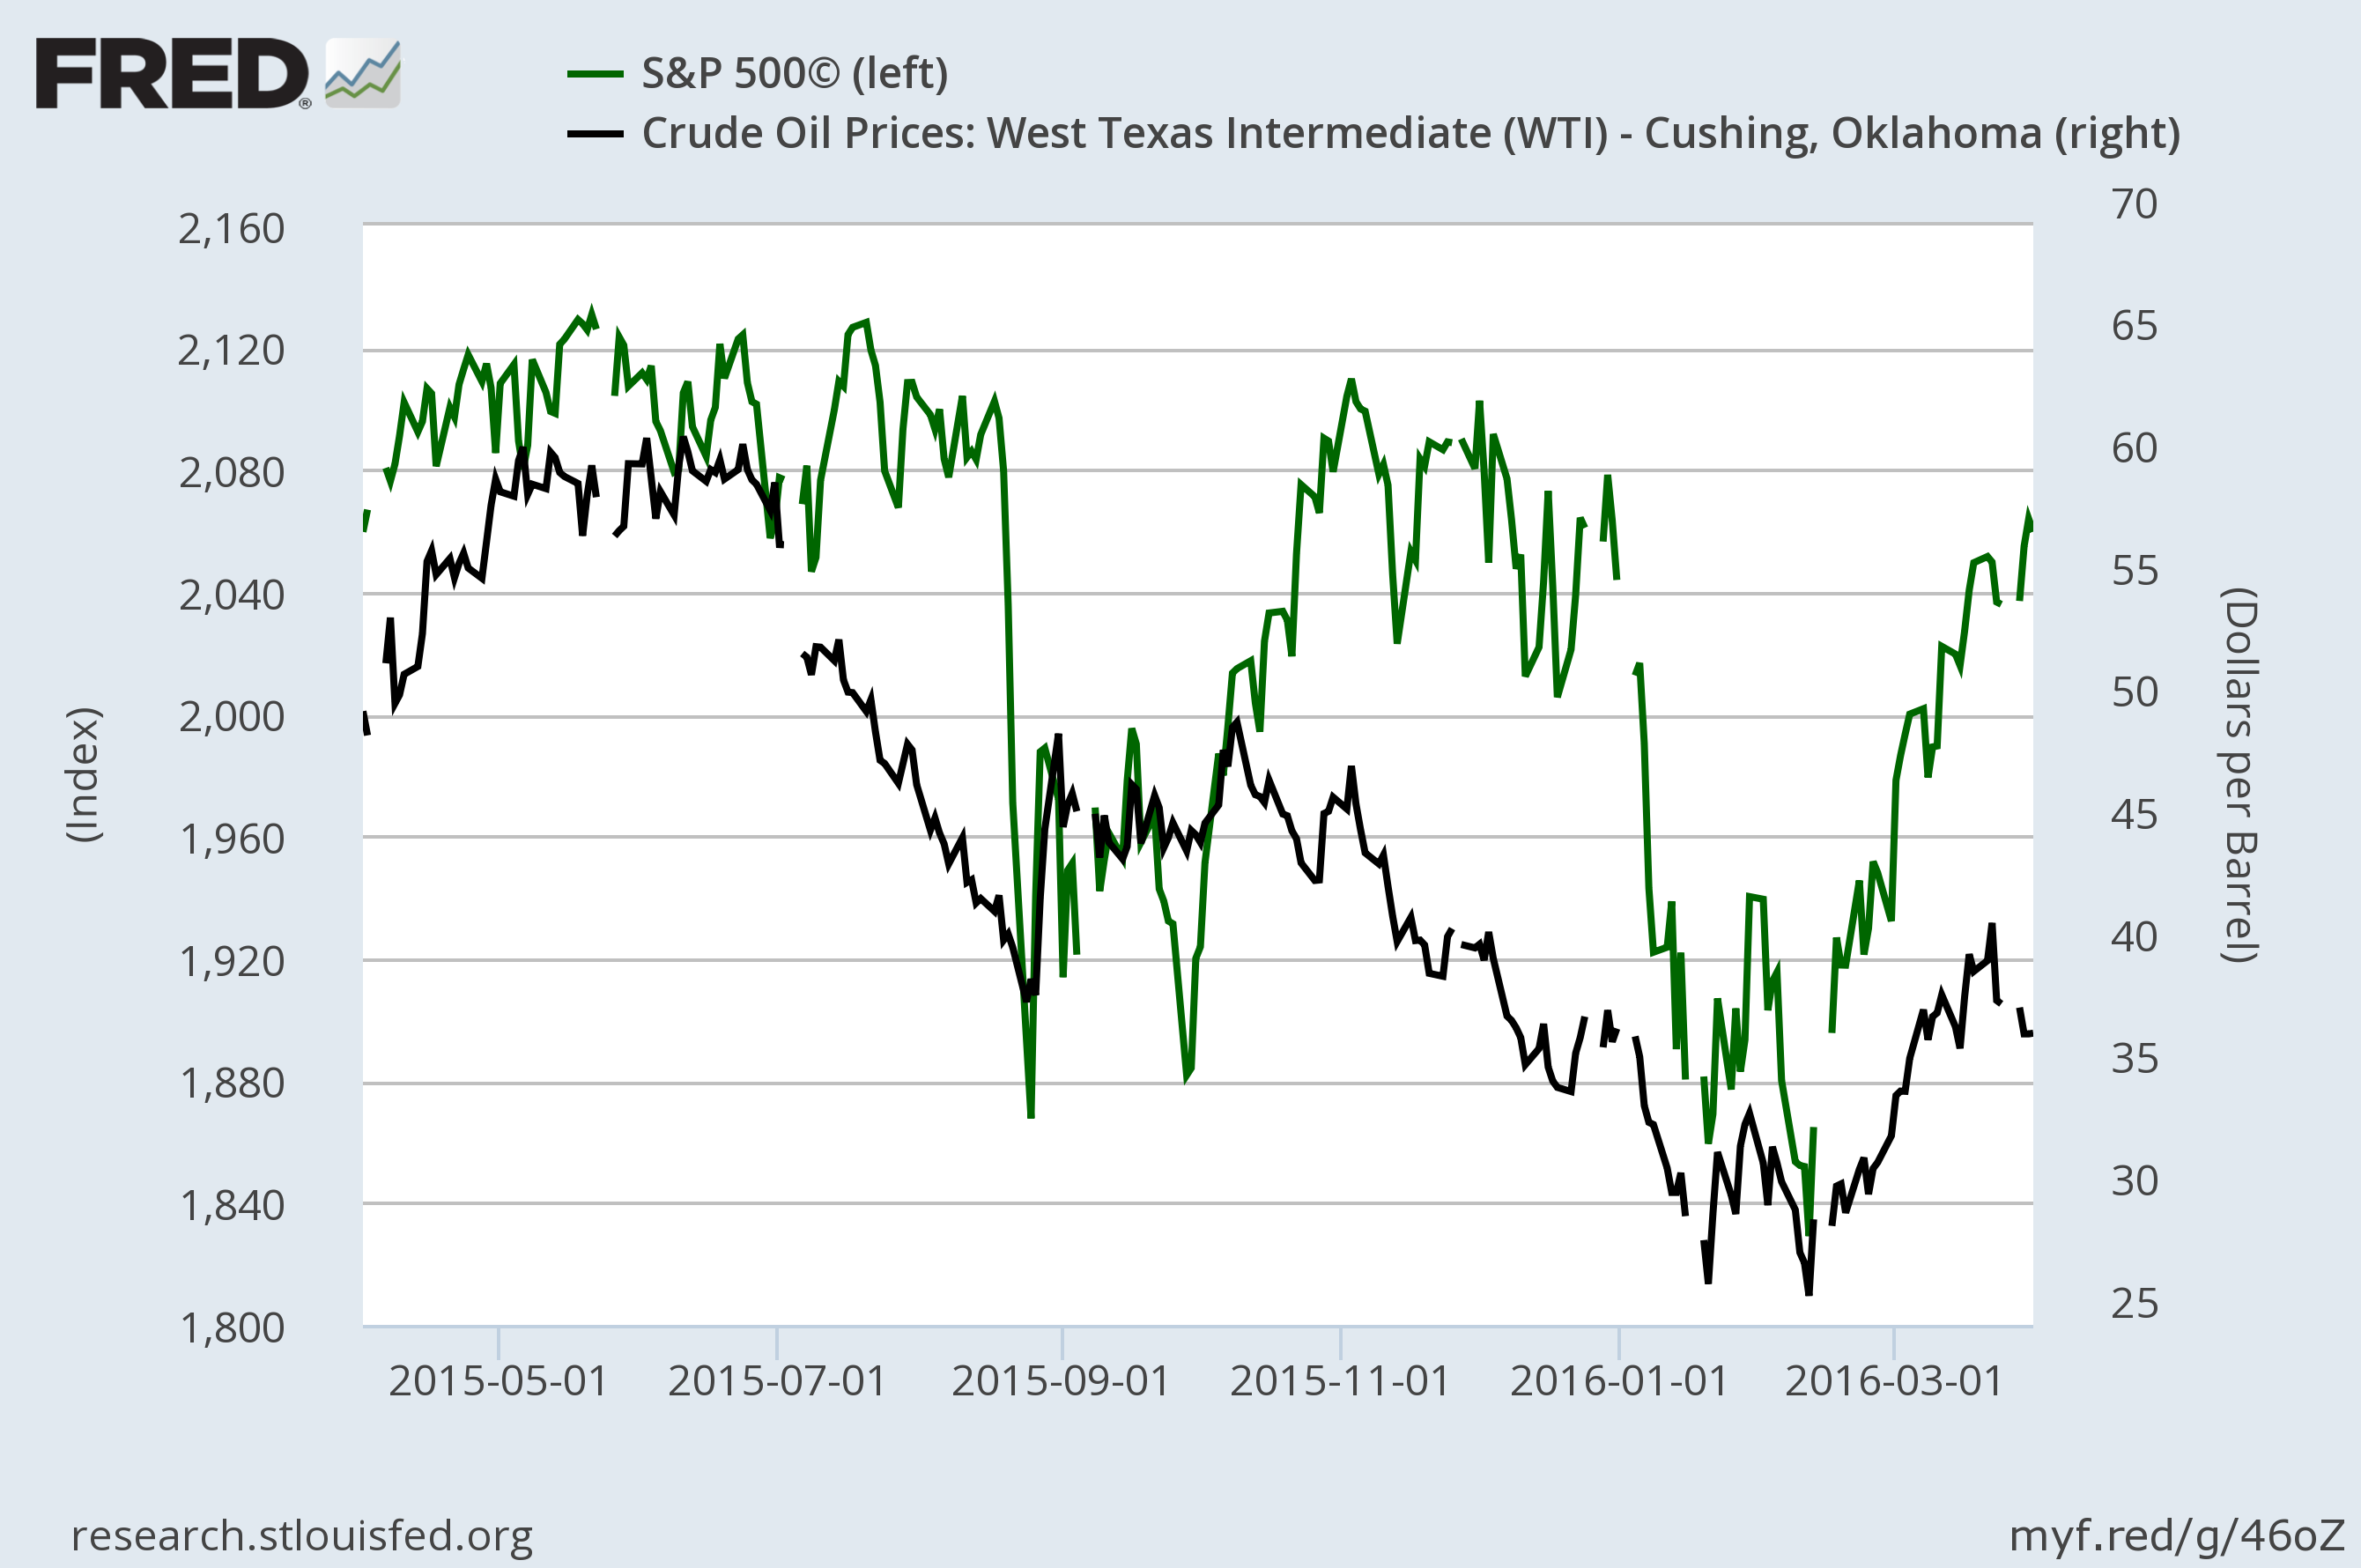
Crossing the $40 p/barrel mark near quarter-end was a meaningful accomplishment as this level provides much relief to energy and energy-related companies. And while a $45 p/barrel mark is widely considered an industry average breakeven price, to cling to the $40 mark in the near-term is an important support level. We shall see if anticipated OPEC production cuts later during 2016 actually occur. IF they come to an agreement, and IF they abide by that agreement, then a meaningful move higher in the price p/barrel could occur in the summer and fall of this year. A price in the neighborhood of $50 p/barrel would likely soothe the markets. A price anywhere close to $70 p/barrel and we will then likely start talking about oil as getting “expensive” again.
- Economic Factors.
The start of 2016 was plagued by concerns that the U.S. (if not the globe) was heading into recession. The reported upward trend in initial jobless claims caused immediate concern. Historically, initial jobless claims have tended to trough several months before unemployment starts to rise. This triggered fears that the steady fall in the unemployment rate that has supported the 7-year recovery could be coming to an end. Revisiting last quarter’s discussion of the math behind stock prices, we know that even small changes in long-run growth expectations will have a large impact on current stock prices.
However, initial jobless claims are naturally more volatile than the longer-term unemployment rate and often give false warning signs. Since mid-February, the trend in initial jobless claims improved, calming market fears about the U.S. labor market. Considering some positive news from the Household Labor Force Survey, and strong job openings data, stock prices began their lift-off in the second half of the 1st quarter.
Another source of concern at the start of the year was the continued weakness in U.S. manufacturing. While not a robust measure of hard data, The Institute for Supply Management (ISM) Manufacturing Survey is a widely followed report and can be useful for quick signals on economic activity. The ISM reported survey data in both January and February signaling a contraction in manufacturing underway since the latter part of 2015. More recently, the index data has bounced back into positive territory (indicating an expansion of manufacturing), and the Regional Manufacturing Surveys have also shown some signs of improvement.
While manufacturing accounts for 14.0% of U.S. GDP, the non-manufacturing component of the Survey (the services sector of our economy) is a more influential element at about 77.0% of GDP depending upon the measurement. While the non-manufacturing index data remains positive (continues to indicate expansion) service sector rate of growth has been slowing for 5 moths, and it will be important to watch this data-point closely in the months ahead.
Releases from major economies around the globe mirrored similarly weak fundamentals as the U.S. and fueled similar concerns throughout foreign markets. Central banks in those markets (the E.U., Japan, and China most notably) were forced to intervene in much more direct fashion.
Nonetheless, the U.S. economy is on more solid ground than thought as we opened 2016. While we will likely have another quarter or two of softness, including some revisions downward of these and similar numbers, our view is that we are simply experiencing a slowing of the rate of growth in the near term rather than a reversal towards recession.
- Central Bank Actions.
Looking back through my daily notes for the 1st quarter, it appears that the seeds for the dramatic rebound were planted on January 27th. That is the day the Federal Reserve’s FOMC surprised markets by not hiking interest rates again immediately on the heels of the December hike. The markets were bouncing about in a range-bound fashion waiting for any signal that could provide direction for the next trading leg. Although the FOMC’s restraint did not immediately break us from the range-bound trade, the minutes from that FOMC meeting did send notice that the members were paying close attention to concerns at home, and to the mounting risks abroad. The Fed’s soothing words helped when they indicated that the pace of future interest rate increases would be affected by international events. Those seeds planted on January 27th sprung forth in the evening of February 11th in a confluence of events that signaled the change in direction.
Between the January 27th meeting and the market bottom on February 11th, there were signals that the market was in bottoming mode. Energy prices had slowed their free fall, and the number of stocks hitting fresh 52-week lows was no longer expanding. That latter statistic is a meaningful measure for most technicians. On February 11th, America’s unofficial central banker, JPMorgan/Chase CEO Jamie Dimon, cast a vote of confidence for his beaten down bank’s shares, and the stock market as a whole, when he put up more than $25 million of his own wealth to buy an additional 500,000 shares of JPMorgan stock. While not the “cause” of the turnabout, a lot of credit is given to Jamie Dimon with turning investor sentiment.
In the weeks that followed, the stock market got another boost from additional stimulus measures from the European Central Bank, steps by China to steady its economy and wild currency swings, solid economic data in the U.S. allaying recession fears, and a sharp rally in distressed assets powered by bearish investors reversing their negative bets. Fed Chair Janet Yellen added to the bullish tone and turnaround late in the quarter when in mid-March the FOMC dialed back its plans for interest rate hikes planned for 2016 from four to two.
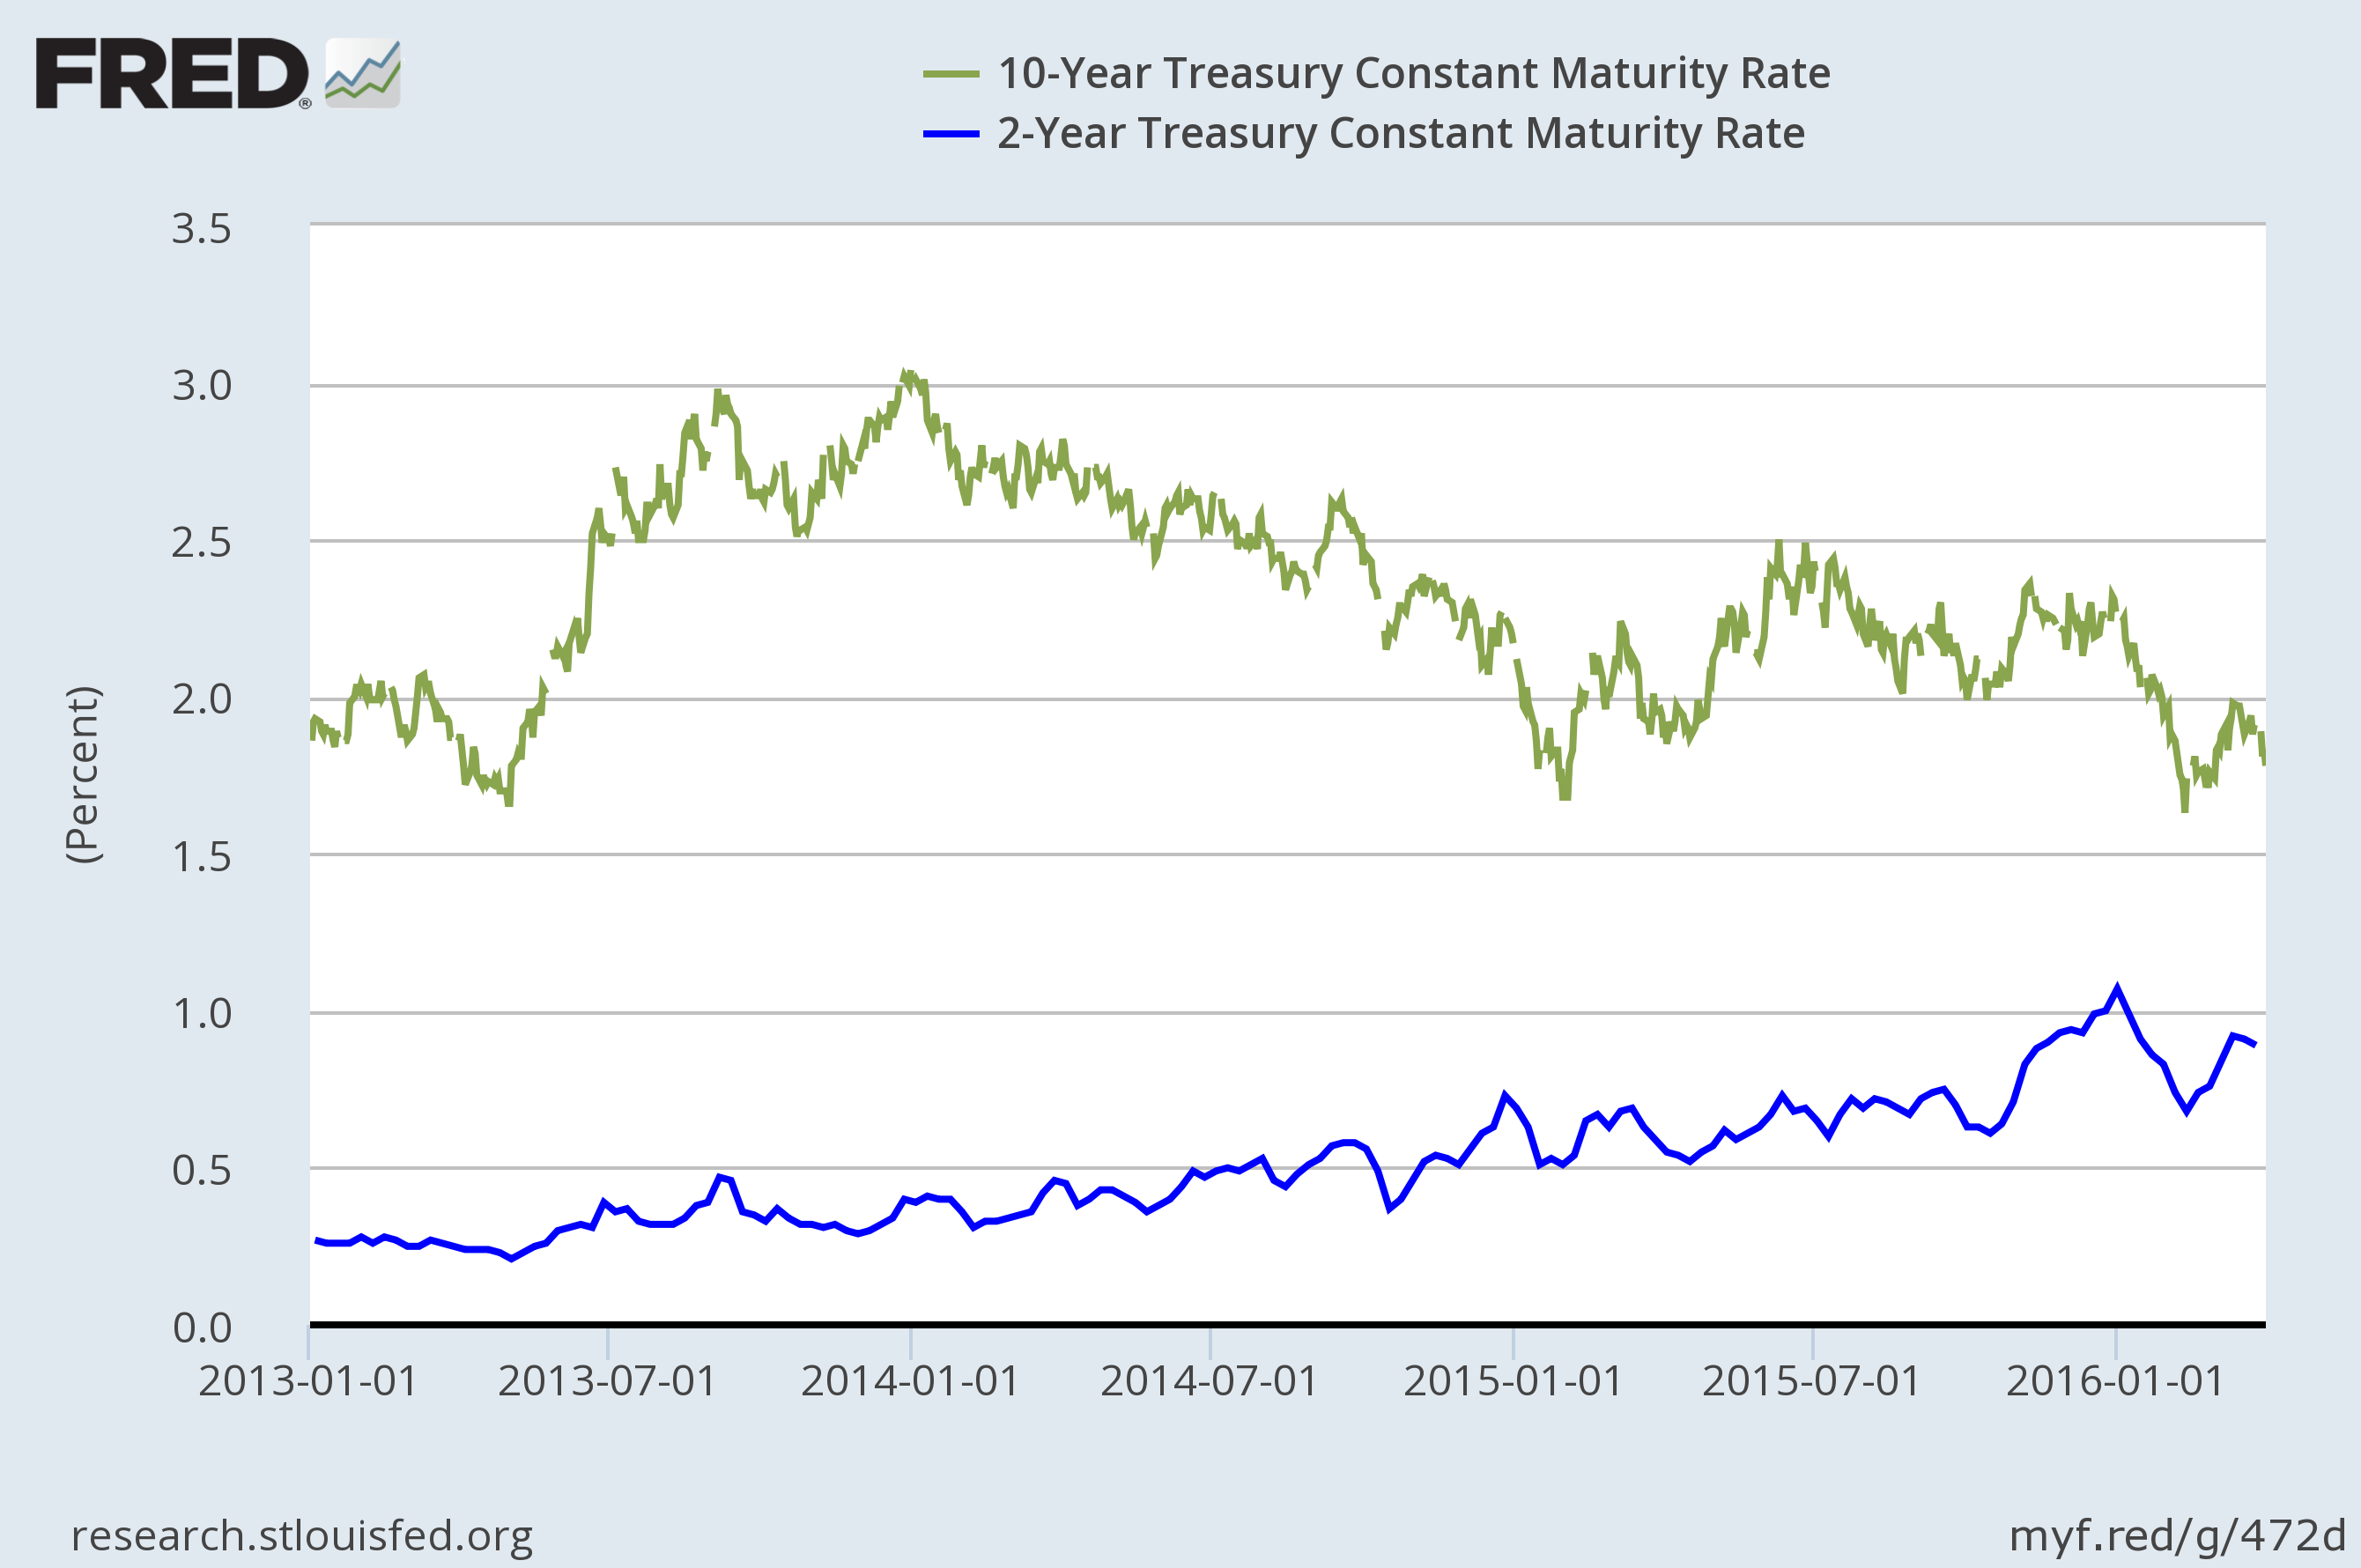
In the bond markets, once the fear of rapidly rising interest rates abated, both government and corporate bond price indices moved to the upside. The 10-year Treasury yield fell from 2.27% at the end of December to 1.77% by the end of March (bond prices and bond yields move in opposite directions). The Barclay’s Aggregate Bond Index (a broad measure of intermediate terms fixed income investments) returned 3.03% for the quarter. We were not willing to take the risk that the FOMC would pause in its move towards higher rates. We have taken a more conservative position with our bond allocations for clients, choosing to remain invested at about a 2-year duration. A shorter duration investment (2-year) will not fall in price as dramatically as a longer duration (10-year) investment when interest rates increase. However, when interest rates fall the price of a short duration investment will not rise as dramatically as a longer duration investment. This is why our holdings returned about 1.6% for the 1st quarter.
- Currency Impacts.
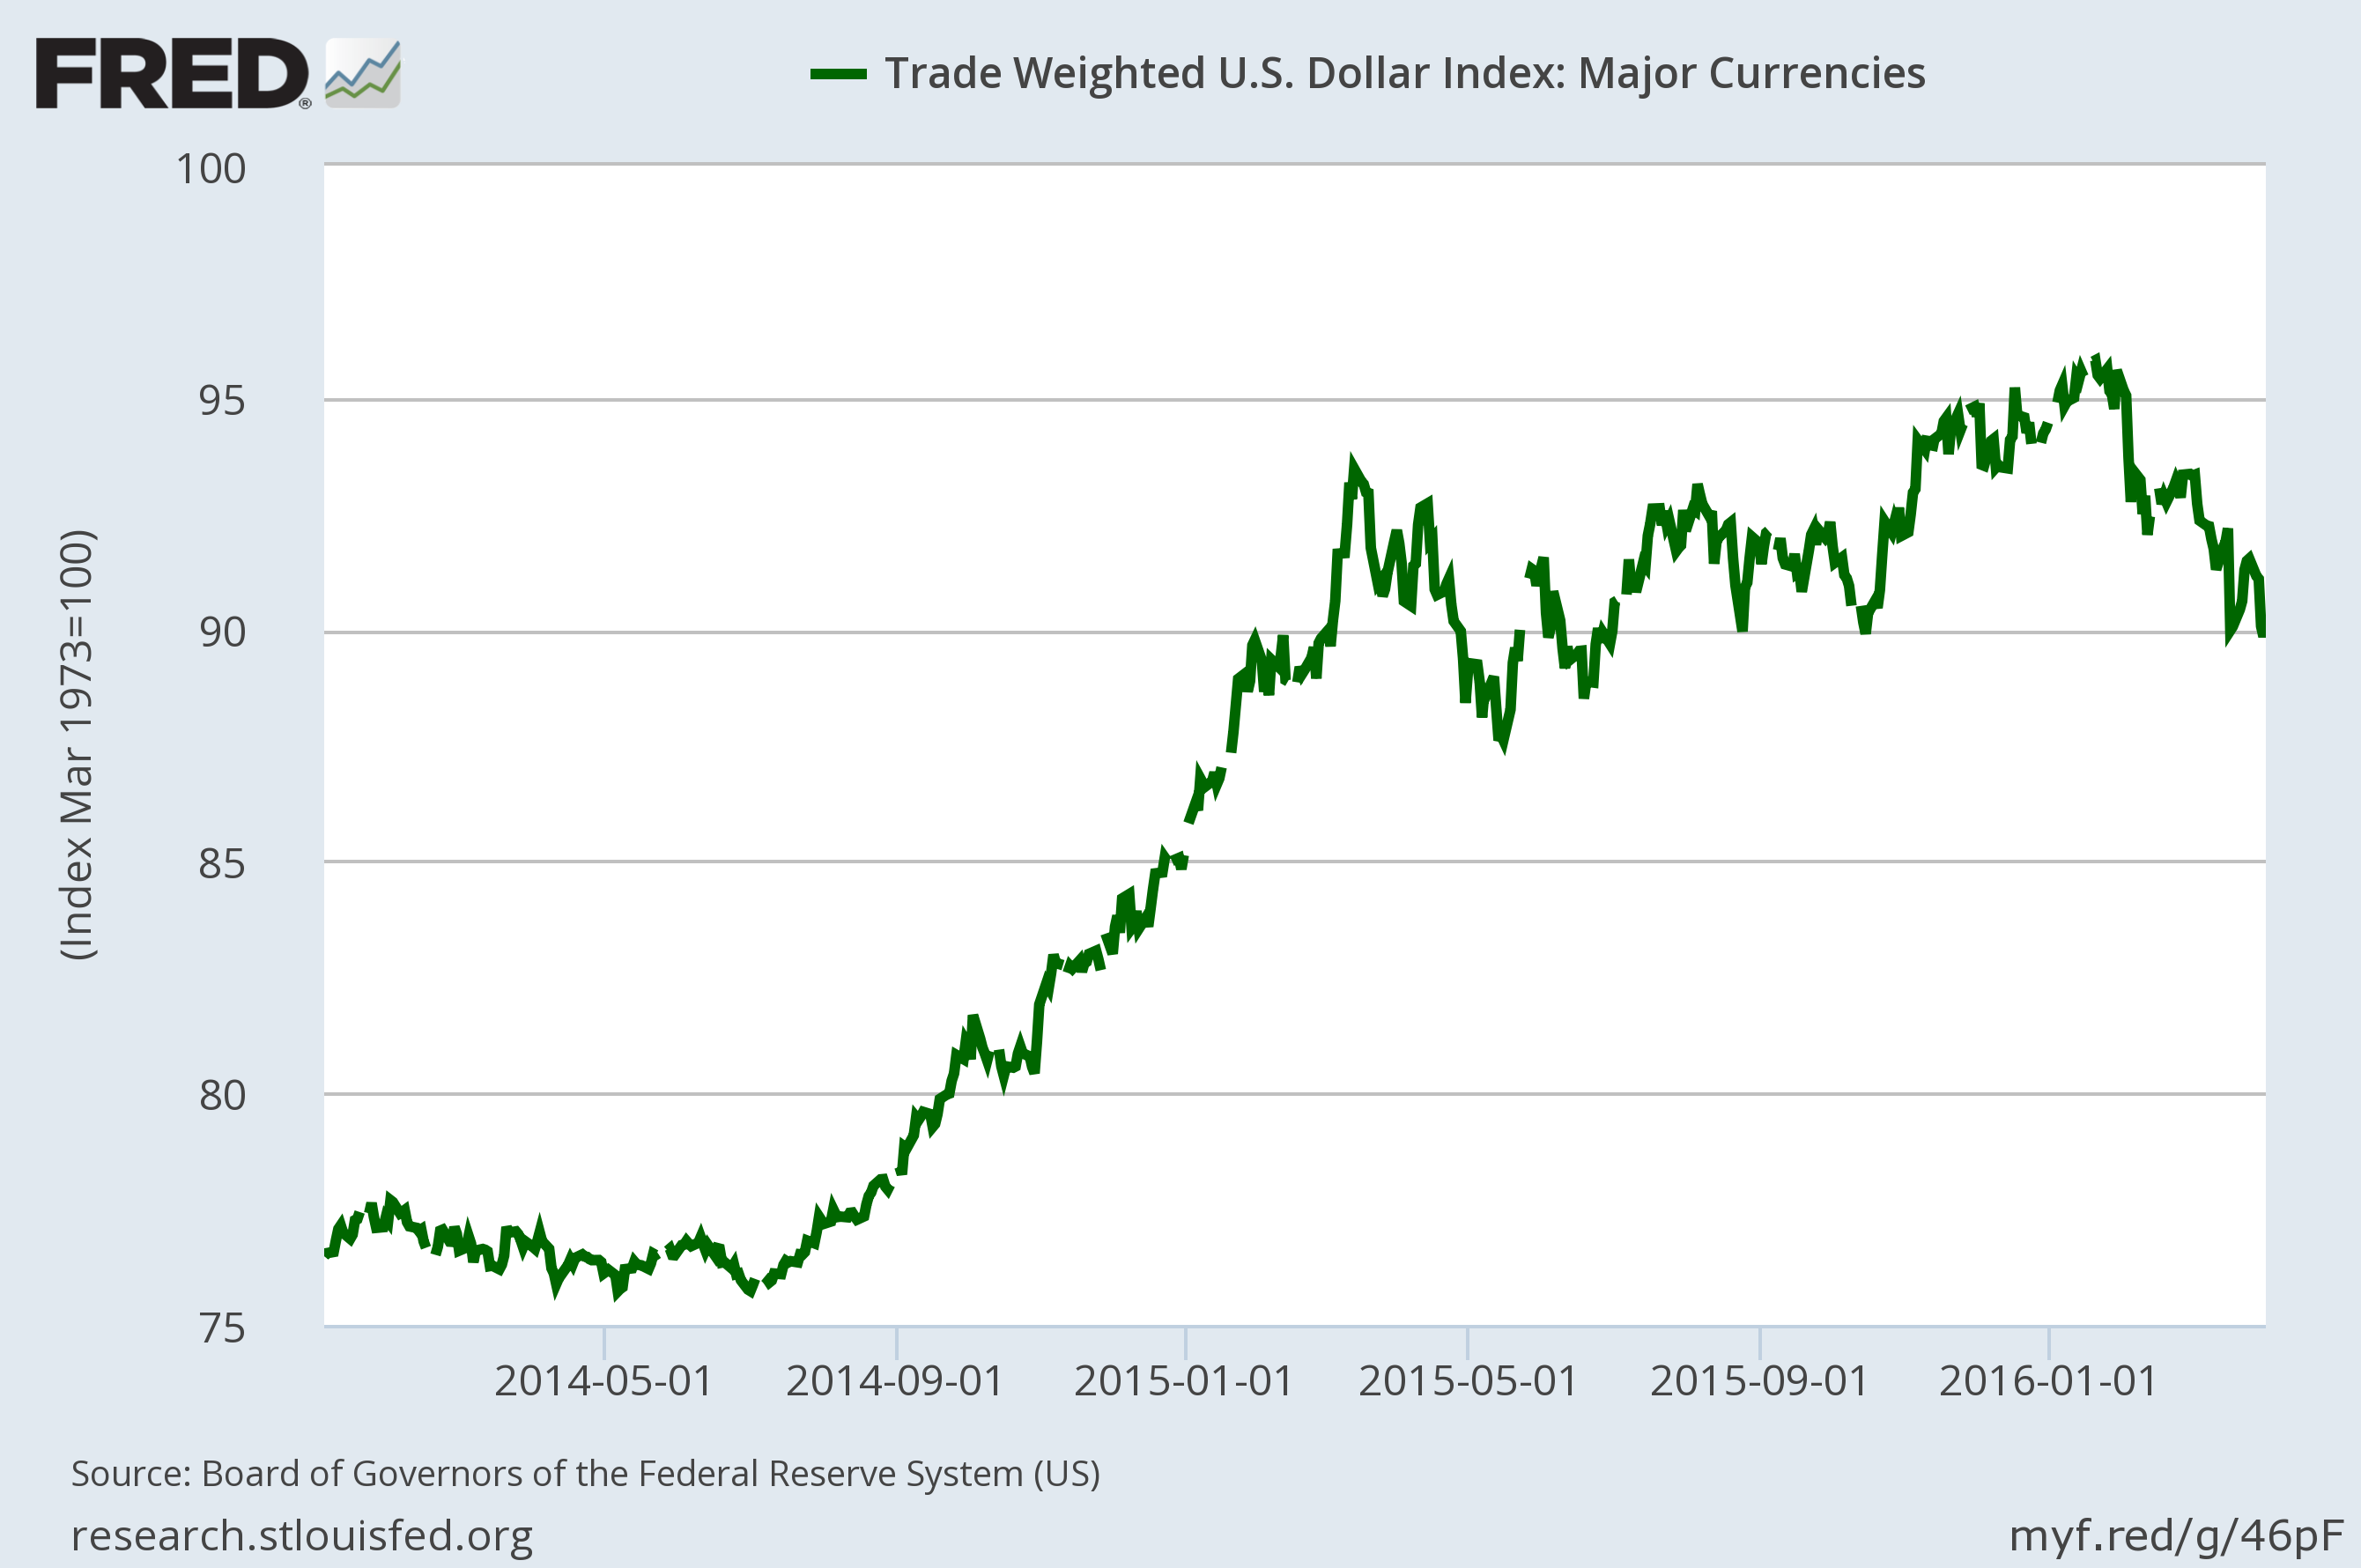
As we discussed in last quarter’s review, a strong dollar is good for U.S. consumers (we can buy more stuff from other countries), but not so good for U.S. businesses (they can not sell as much of their stuff to other countries). So while the consumer-based parts of our economy are helped, U.S. businesses that generate significant earnings abroad are hurt. Additionally, the translation effect on those foreign earnings mean that those U.S. companies lose when exchanging those earnings back into U.S. dollars (those foreign currencies can’t buy as many dollars). As with last quarter, the U.S. dollar is too expensive. But it did get a little cheaper during the last half of the 1st quarter.
With a cheaper U.S. dollar, when a U.S. business generates earnings in foreign markets, and those earnings are converted back into U.S. dollars for financial reporting and tax purposes, they simply get more U.S. dollars in the exchange. When the value of the U.S. dollar is lower relative to foreign currencies, those foreign earnings, simply by exchanging them back into U.S. dollars, are suddenly worth more. U.S. companies keep more of what they earn overseas, their earnings increase and stock prices increase. It is a virtuous cycle, but one that is easily upset and can take many years to equilibrate.
As always, we are keeping our eyes on all of the moving pieces across the globe and across markets. While much of 2015 and the first few weeks of 2016 did not favor some of our portfolio biases, most of our biases contributed solidly to client returns in the post-February 11th recovery.
- Our overweighting of small-cap (+2.63%), mid-cap earnings (+3.65%), and mid-cap value (+1.73%) company indexes contributed nicely to excess return versus the S&P 500 during the 1st quarter.
- Our overweighting of the materials sector (+4.64%), and the consumer discretionary sector (+1.61) contributed positively to excess returns versus the S&P 500 during the 1st quarter.
- Healthcare represents one of the largest sectors of the U.S. economy. It is pervasive throughout every size and style category and encompasses an unimaginable breadth of related businesses. There are parts of the healthcare sector that we like very much, and some parts that we don’t like. During the 1st quarter the healthcare sector underperformed all other sectors with a loss of -5.90%. In our portfolios we create an effective underweighting of the general healthcare sector by creating overweights to specific sub-sectors within the healthcare sector. For example, we overweight medical devices and medical technology companies. Devices and technology returned +0.04% during the 1st quarter, below the 1.3% return for the S&P 500 but far better than the -5.90% for the general healthcare sector.While many of our biases contributed nicely to excess returns during the past quarter, there were a few biases that did create a drag on quarterly returns.
- Continuing the healthcare sector discussion, in our large, growth oriented portfolios we also overweight biotechnology/genomics companies (-24.2%), and pharmaceuticals (-14.1%). While we maintain our conviction that these are fruitful areas for long-term growth, they are also more volatile than most sectors of the market and react more harshly to growth-related fears. As such, these sectors were among the most beaten down during the 1st quarter. And while one would expect that they also be among the quickest to recover, political pressures associated with the Presidential election cycle have influenced the sector in ways that are unrelated to fundamentals. We believe time and patience are the watchwords in these spaces.
- All of our portfolios have large allocations to international markets, both international equities and international bonds. During the 1st quarter our method of executing comprehensive international exposure returned approximately -1.4%. We feel pretty good about this number actually when compared to many of the major markets across the globe. For example, the MSCI EMU (a representation of the 10 Developed European Monetary Union countries) returned -6.6% for the first quarter.We remain committed to our strategies for the long haul and see no reason to undertake any significant changes. We have, however, adjusted some of our sector performance expectations and in response will be making small changes in some allocations as opportunities present themselves during the 2nd quarter. Should significant events unfold you can be certain that we will provide updates as needed and advance notice of any significant deviations in portfolio strategy should market forces warrant them. We are available at any time, any day of the week, to discuss specific portfolio and performance questions. Until then, be well and enjoy the rest of your weekend!
A.J. Walker CFP® CIMA®
Founder and Senior Consultant
Lake Jericho, LLC