Lather. Rinse. Repeat? Maybe Bill Murry’s experience in the movie Groundhog Day is the appropriate comparison. Either way, I am writing about the same themes, if not the same things, this year. But portfolio gains continue to roll in, so I do not want to jinx this groove. Economic growth continues to expand across the globe. Expansion is improving corporate earnings throughout the world’s economies. Improving corporate earnings are providing fundamental support for global equity market’s steady grind higher. Low interest rates, geo-political stability (despite puerile rhetoric and media induced anxiety), normalizing energy/commodity prices, and normalizing currency relationships persist. Despite investor’s behaviorally-biased anxiety associated with notching repeated new market highs, there is calmness in the markets evidenced by historically low levels of volatility. When volatility does appear, it is short-lived and in a short-list of market sectors (if not a short-list of individual stocks) from which investors rotate out of and directly into other investments. At no point this year has there been a wholesale liquidation of broad market holdings. Will this last forever? Absolutely not. Does there exist any clear, fundamental signal that this will end today? Not really. Will there be some type of pull-back in the near-term? History tells us that there will be. What should we do about it? The math tells us to keep doing what we are doing.
Q3 Review
Despite a painfully slow start and now a mind-boggling eight years old, the global economic recovery is well under way. Finally, after years of continuous monetary stimulus major developed economies (U.S., Europe, Japan, et. al.) are seeing firm growth and inflation data. The U.S. is now slightly weaker compared to developed market peers, but more meaningfully so compared to emerging market economies where growth has outpaced the U.S. for some time. While some in the U.S. may lament “too low” of growth and inflation data, I view data continuing slightly below central banker’s targets and well below the White House’s targets, and the resulting measured pace of policy responses, to be a terrific thing for Lake Jericho clients. History has proven, repeatedly, the ill-effects of boom-to-bust cyclical swings made worse by heavy-handed political action or central bank policy intervention. While market speculators and Wall Street insiders might benefit from big brother’s thumbs-on-the-scale tilting market forces in their favor, it comes at a cost to Main Street investors and long-term savers. So I am perfectly comfortable with a measured pace of recovery, a slow pace by policymakers as they remove monetary accommodation over a period of years supported only by underlying economic fundamentals. In past commentary I have gone into excruciating detail about the market mechanisms that make important economic variables (growth rates, interest rates, currency exchange rates) inextricably intertwined and their effects upon client portfolios. I will spare you the halloween-season horror of that level of discussion. I will simply remind everyone that a boring path is a good path. A boring path means that economic growth can be reasonably forecasted, inflation is of the expected variety, interest rate movements and long-run relationships in currency exchange rates can be signaled and managed.
We began our Q2 Review with a lengthy discussion of volatility. Volatility, or rather the lack of volatility, is also important in the Q3 story. The current low level of volatility, and the long-run downward trend in market volatility, is partially an outcome of “boring” paths and the benefit of a soft-handed approach to market intervention. Again, in the U.S. there were a few pockets of sector weakness and market volatility during Q3 as measured by the Chicago Board Options Exchange (CBOE) Market Volatility Index (VIX). But it remains important to view these few, short-lived periods of volatility within the context of what continues to be a period of the lowest market volatility in the history of the measure. The few, short-lived periods of volatility have largely been due to transitory issues rather than fundamental problems, and have resulted in investor rotation amongst markets or market sectors rather than broad-based market sell-offs. Whereas the VIX spiked by 40% during the final week of Q2 before settling back to historic lows, that Index spiked again by about 76% during August only to fall back to even lower marks not seen since January, 2007. The graphs below is included for a bit of historical perspective on that 76% August jump in volatility; a 76% jump from a historically low level does not even register as a blip in the long-run trend. As a bit of forward-looking insight, we see historically a slow turn higher in volatility before significant events occur. It is for a reversal in trend we most watch for, rather than transitory events. In a time of attention-spans that last no longer than a daily news cycle, it might be difficult to recall mid-August from mid-October. But mid-August saw the saber-rattling between the U.S. and North Korea, the fallout from President Trump’s comments about the Charlottesville protests, and heavy flood damage in Houston and Florida from hurricane activity. To borrow another’s analogy, August came in like a lamb, turned into a lion, and then left like a lamb. If you looked only at the market numbers from the beginning and the end of Q3 you would never know that anything of consequence had occurred.
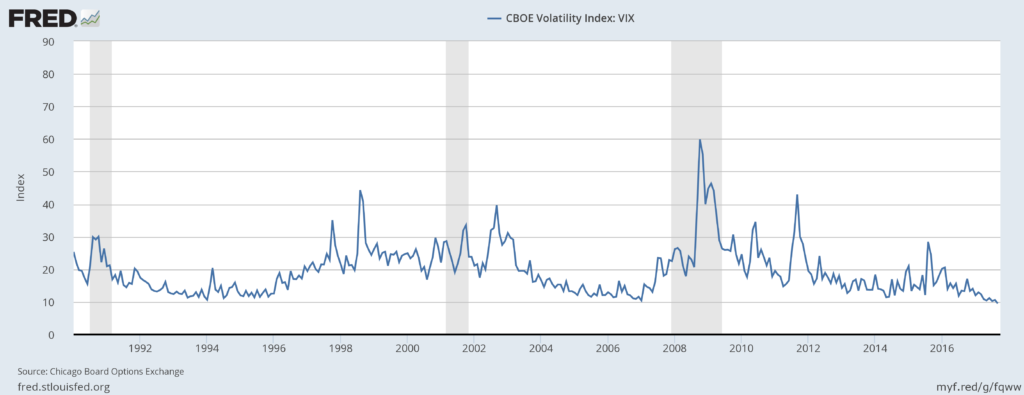
CBOE Volatility Index (VIX) through Q3 2017
Generally speaking, nearly all industry sectors and portfolio strategies are positive thus far during 2017. Big companies, little companies, U.S. companies, foreign companies, emerging market companies, growth-oriented strategies, value-oriented strategies, are all up solidly. The U.S. sectors and strategies that most benefitted from the post-election “Trump-bump”, excelling in terms of relative performance during 2016 (small company stocks, banks, infrastructure, cyclical/value-oriented strategies), that had lagged in the first half of 2017 managed to close much of the YTD performance gap during Q3. Professional investors look to these types of “participation” measures, tests of both the breadth and depth of market performance, to measure market health. With continued wide and deep participation in the current market rally, most consider equity markets to be healthy. With the exception of the Energy, Real Estate, and the Consumer Staples sectors, the YTD return numbers for most major sectors and strategies are relatively close by historical standards. As the forward-looking performance of these three sectors is somewhat tied to interest rate outlooks, it is no surprise that these three sectors might somewhat lag in the current environment as rates are slowly trending higher.
Getting to the specific decisions that influence Lake Jericho client portfolios, let’s briefly cover each of the five levels of our portfolio construction process. And as a brief reminder, no client portfolio will match perfectly typical/target allocation decisions, or sector allocation percentages, as every client experience is unique. These unique factors (such as portfolio start dates, timing of asset transfers, timing of individual contributions or distributions, overall risk profile, etc.) certainly impact exact performance attribution of our strategic and tactical decisions. However, what follows will generally inform you of the nature and direction within your own personal portfolio. Clients should carefully review their individual performance information provided to determine and understand how their particular portfolio is impacted by these decisions and performance versus appropriate benchmarks.
U.S. versus International
On a total return basis the S&P 500 Index gained 4.48% during Q3, 14.24% YTD. The Dow Jones Industrial Average (DJIA) gained 5.58% during Q3, and 15.45% YTD. These are among the best quarterly numbers seen in five years. The biggest YTD gains among U.S. diversified funds are large-company growth-oriented funds, in large part thanks to the red-hot, mega-cap technology stocks. Technology is now the top performing industry sector YTD despite experiencing pockets of market volatility during the year. The tech-heavy NASDAQ clearly demonstrates this fact having returned 21.67% YTD. The healthcare sector, and especially certain sub-sectors within the healthcare space, are a close second in terms of YTD performance. While technology is up about 23% YTD, healthcare is up about 20% YTD with several sub-sectors within healthcare up by 25% to 30% YTD. The only sector in the red for 2017 is the Energy sector, down almost 7% YTD. Energy has yet to fully recover from the early-year sell off in crude and the impact of the Q3 hurricane season in the U.S. gulf region. However, improving crude prices thus far in Q4 could go a long way to reversing that energy slide heading into year-end.
Aside from improving local growth, international markets continue to get a bit of help from a generally weaker U.S. dollar. Due in large part to improving international economic growth, corresponding increases in foreign interest rate expectations, and surprisingly even due to uncertainty surrounding U.S. economic policy, a weaker U.S. dollar is driving a good portion of the outperformance of international equity markets this year. Although the U.S. dollar as measured by the DXY increased in value by about 0.45% during Q3, YTD the dollar is lower by about 7%. Supported by a weaker dollar, the Morgan Stanley All-country World Index (excluding the U.S.) is up by 21.13% YTD. Even better, emerging market indices are up by about 26% YTD. Our overweights to international investments (with small-company, and emerging market overweights imbedded in those investments) have served as a meaningful tail wind for clients thus far during 2017.
Stocks versus Bonds
Interest rates are on the move higher. As long as the move, or the trend in the move, is reasonably paced then the move over time can be deftly managed. Lake Jericho managed portfolios have been defensively positioned against the impact of rising interest rates since 2015, in terms of lower allocations to bonds than is considered typical, in how we constrain allocations to equity investments with high negative correlation with interest rates, and in how we position the bond investments that we do hold. We continue to believe that this defensive position is best in the current environment as current bond yields provide little protection from adverse price-movements should rates move quickly higher. While certain elements of our defensive position might not add to portfolio returns in many environments, it is relatively “cheap” risk insurance for a small piece of client portfolios that does not detract meaningfully from portfolio returns in the long run. While our bond positions have been a head-wind for clients during 2017’s outstanding equity market performance, the way in which we construct exposure has been less costly to portfolios than the way in which more traditional managers implement bond investments. And our lower overall allocation to bonds (and higher allocation to equities) than is typical has certainly been a tail wind for clients during 2017.
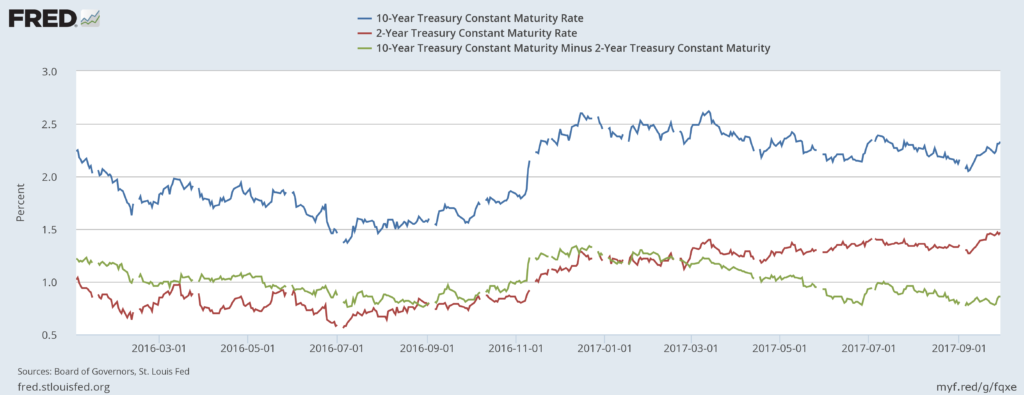
Rising Interest Rates/Flattening Yield Curve
Small Versus Big
The small- and mid-sized company space was one that widely outperformed most other sectors immediately after 2016’s election cycle. That the space has lagged most other sectors throughout most of 2017 is no surprise. Mean reversion is real. Nonetheless, one of our fundamental portfolio convictions is that investors should maintain an exposure to, if not an ongoing overweight towards, small- and mid-sized company equity investments at all times. Among the reasons that we hold this belief is the tendency for small- and mid-sized company stocks to demonstrate “clumpy” patterns of return. While on average, over the long-run, the space can provide superior investment returns versus large-company peers, much of the excess performance can occur in short, unexpected time periods. This pattern can then leave longer time periods of underperformance. We are not in the business of predicting these patterns, much less trading these patterns, rather we are in the business determining and holding as efficient of an exposure to this space as possible over time.
The first eight months of 2017, as well as all of 2015, are time-period examples of a market rotation away from small- and mid-sized company investments. 2016, especially post-election 2016, is an example of why you always want to maintain exposure to the space. During 2016, the way we construct small- and mid-sized company exposure bested large-company U.S. equity investments by 8.60%. But none of these time-periods support a position, statistically, that market-timing or risk taking simply for risk’s sake is its own reward. Statistically, there exists in our determination an approximated optimal allocation of small- and mid-sized company exposure to be held in investor accounts that adds value over time without exposing portfolios to unnecessarily high levels of variability. Our answer to best manage this trade-off over time without engaging in unnecessary trade execution is to maintain a fairly constant exposure to the space, and to employ three different strategies simultaneously that best gain exposure to persistent factors of return within the space. This strategy was once again rewarded during Q3. Having trailed significantly throughout 2017, sinking to the widest depths of the year in August, immediately following the announcement of Trump’s tax reform plan and potential for outsized benefit to small U.S.-based companies the small- and mid-sized company space significantly outperformed large-company counterparts to pull ahead for Q3.
To fairly evaluate our process in the “small versus big” space, we look to the Russell 2500 Index for comparisons. The Russell 2500 Index is a broad measure of blended strategies in both small- and mid-sized U.S. company stocks. During Q3 the Russell 2500 returned 4.74%, 0.26% ahead of the S&P 500 for the Quarter. While slightly ahead for Q3, the small- and mid-sized U.S. company space is behind the S&P 500 YTD but essentially even for the rolling one-year period.
Value versus Growth
As with small- and mid-sized company exposure, we also believe that investor portfolios should maintain exposure to, if not an ongoing overweight towards, value-oriented investment strategies. The basic premise of value investing is that certain securities are underpriced bargains and are likely to outperform once their “real value” is fully appreciated by investors. It is a bit of common sense, supported by the statistics, that if you remain mindful of not overpaying for your investments then you are more likely to achieve superior returns over the long-run. Value-oriented investing is one method that helps investors achieve this objective. A gross over-simplification of an entire field of financial study, but that is the basic idea.
Last year, U.S. value-oriented equity funds as a group were up 20.79%, according to Morningstar, while U.S. growth-oriented equity funds as a group rose only 3.16%. As a value-biased portfolio manager, Lake Jericho clients certainly benefited from that differential during 2016. But with the overwhelming outperformance of value-biased strategies during 2016, and of certain elements of value-oriented strategies during Q1 2017, that value strategies lagged growth strategies by a wide margin during Q2 is not a great surprise. Again, our focus is on maintaining long-term, strategic positions and not on attempts to time trading patterns. As with the small- and mid-sized company space, Q3 provided some relief for the 2017 performance differential in value versus growth.
Sticking with Morningstar measurements, during Q3 2017 U.S. value funds as a group were up 4.48% to equally match the return of the S&P 500. However, those red-hot mega-cap technology stocks did lift U.S. growth funds as a group by 5.33%. While better, with the continued type performance differential for YTD 2017, how could the Lake Jericho managed portfolio compete? Again, I offer a gross oversimplification, but there are two ways in which we managed to offset that performance gap. First, a large part of our value-biased positions increased in value significantly during 2016 (particularly post-election) meaning they begin to exhibit, statistically, more growth-oriented characteristics. Over time, due to portfolio turnover, our positions will return to a more typical value-oriented performance profile. Second, our value bias is constructed both domestically and internationally. During both Q2 and Q3, international markets simply outperformed U.S. markets. Putting both factor exposures together, our target value bias remains a tail wind for client performance. For YTD 2017 and on a rolling one-year basis, our target value bias with both domestic and international exposures has contributed positively to performance.
Sector Allocation Decisions
Finally, strategic and tactical sector weighting, the fifth aspect of our portfolio construction process, was an important part of how we added value during Q3. Our process of underweighting U.S. equity market-neutral benchmark allocations in favor of overweighting higher expected growth sectors (currently materials, medical devices and technology, pharmaceuticals, biotech/genomics, and early additions to regional banks and emerging markets) were a mixed bag for the quarter. Two of our most meaningful contributors during Q1 and Q2, medical devices and pharmaceuticals, reversed trend and actually detracted from client portfolio performance during Q3. Medical devices (4.11% behind the S&P 500), pharmaceuticals (0.17% behind the S&P 500), and regional banks (0.78% behind the S&P 500) all served to detract from client performance. Materials (1.72% ahead of the S&P 500) and biotech/genomics (4.85% ahead of the S&P 500) served to add to client performance. Direct emerging market exposures are too new to objectively quantify attribution as of yet. In summary, for Q3 our sector allocation decisions served to reduce the average client portfolio by about 0.03%. It was really a non-event in terms of comparison with a market-weighted portfolio. However, for YTD 2017 our sector allocation decisions have added 1.33% in additional returns versus a market-weighted portfolio to the average Lake Jericho client account.
Near Term Outlook
Let’s first lay out a few current market realities.
- The S&P 500 passed through 2500 recently, and the DJIA just this week overtook the 23,000 mark.
- We are at 40+ new market highs this year, and closing in on 50.
- Market volatility is at all-time lows.
- Market internals, things like short-interest and call-option purchases, all indicate upside expectations abound.
- Q3 earnings season is off to a strong start and thus far is reinforcing market valuation levels.
- Macro data continues to support growth expectations, if not upward revisions of growth estimates.
- The unemployment rate sits at 4.3%, yet inflation is subdued at just 2.2%.
- The 10-year treasury bond yield is still well below 3%.
- We haven’t had an economic downturn since the last one ended in mid-2009, making this one of the longest recoveries in history.
These are all great things, right? Of course they are. I would be the first to sound the warning should I see something worrisome in these data points. It is always my full-time job to evaluate the data, to understanding risks, and to execute efficient ways of managing those risks. It is also part of my full time job to occasionally reassure investors that times do exist when we can take a breath and simply enjoy a ride. They are few and far between, so enjoy what the market it giving us. In the mean time know that I am watching events on the horizon that could create bumps in this smooth ride. There are a few matters (the tax-policy debate, a potential change in the Federal Reserve chair, currency shocks due to unforeseen policy events) that create potential for upset, but nothing that I see on the horizon as immediately problematic. For the near-term, at least through year-end, I plan no meaningful changes in strategy or execution.
Having said that, I am keenly aware that it is closing in on two years since stocks have seen a 10% correction, and I don’t recall without looking when the last 5% correction occurred. And tomorrow just happens to be the 30th anniversary of “Black Monday”. I know that it is this type of market reality that is causing the greatest amount of investor concern. I also know that this concern is rooted in historical context and not conditioned by the current data. And that is OK. That is human nature. I follow Ben Carlson’s blog, and in a recent post he stated “This is why understanding yourself is the most important part of the investment process. If you don’t understand yourself — your reactions, your personality traits, your biases, your limitations — it doesn’t matter which type of investor you’re supposed to be. It matters which type of investor you are.” I like that blurb because it best informs me why I am here, and what the most important element of my responsibility happens to be. My responsibility is to be the voice of evidence-based reason, to align the type of investor each of my clients is supposed to be with the experience that each achieves. In short? I must be a capable technician, but I must be an even better investing “coach”.
As always, I am available at any time, any day of the week, to discuss specific portfolio performance questions. I will also be in touch with many of you in the coming weeks to conduct needed reviews of goals and objectives, make any needed changes as a result, and to walk through a few administrative tasks that we might need to tackle. Until then, be well, enjoy the rest of your week, and thank you!
A.J. Walker, CFA CFP® CIMA®
Founder, President, and CEO
Lake Jericho, LLC