The thing about crafting a useful investment review at each quarter’s end? I’ve been writing such reviews for more than 20 years and at times I struggle for days (if not a week or so) trying to decide what it is that I most need to communicate. This quarter-end has been one of those times. Often an appropriate review does require one to artfully connect many of the complexities and nuances of the markets. Most times, however, the appropriate review focuses on a short and direct message. Fortunately, even though I have to go through the struggle, I eventually remember that I overcomplicate things just when the message need be most simple. My short and direct message for this quarter? All things considered, we all did pretty well.
When we step back and consider all the crises, both manufactured and real, of the past couple of years (from Grexit to Brexit, from the long trudge out of the depths of the U.S financial crises to current deceleration of growth in major world economies, from fears of rising nominal interest rates domestically to actual real negative interest rates abroad, and let’s not even start on the most bizarre election cycles across developed markets in memory) we are benefitting from U.S. markets that seem to defy gravity’s full effect no matter the headlines. The U.S. economy appears in good shape overall following the slowdown in the first quarter (and the 11% decline in markets) that resulted largely from reduced corporate earnings during 2015. First quarter GDP growth was revised upward in May and continues to exceed inflation measures. Consumer spending (the main engine of the U.S. economy) continues to expand. Manufacturing reports indicate expansion, although still suggest soft growth in the sector. Real estate (including construction and construction spending) continues its upward trajectory. Job opportunities continue to grow (although a bit weaker mid-quarter) with the unemployment rate in the U.S. falling to 4.7%. Despite a few setbacks and a bit of volatility U.S. stocks were nicely positive for the second quarter, a welcome continuation of the rally from the mid-February lows.
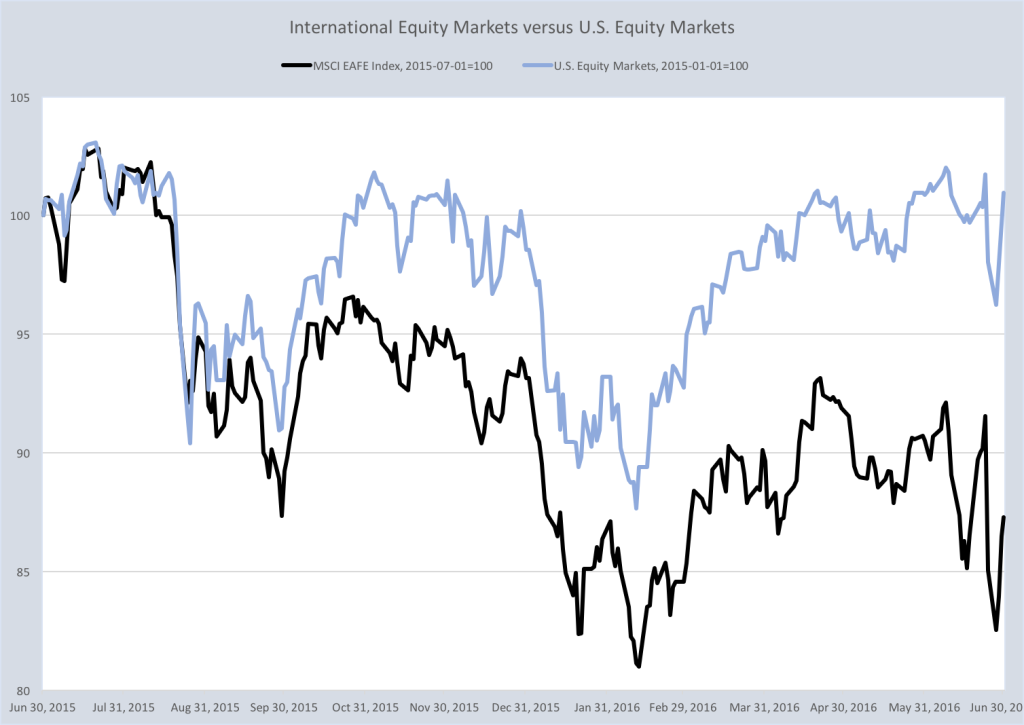
Yes, on June 23rd voters in the U.K. elected to leave the European Union, to the surprise of basically everyone. Global markets reacted wildly with big drops in stocks the following two trading days. U.S. stock markets recovered strongly the next two trading days after that, making up much of the decline. Most major U.S. broad market indices now sit, post quarter-end, comfortably at new all-time highs. Foreign developed markets, and particularly the E.U. markets, have not yet fully recovered but have moved solidly higher. The chart below illustrates the difference between large- and mid-sized U.S. stocks (the MSCI USA Index of large- and mid-sized companies represented by the blue line) versus international stocks (the MSCI EAFE Index represented by the black line). The MSCI EAFE Index represents the performance of large- and mid-sized securities across 21 developed markets, including countries in Europe, Australasia and the Far East, but excludes the U.S. and Canada. The chart makes clear the impact of continued challenges in overseas markets from the Grexit fears of mid-2015, through the global growth fears related to China surrounding the 2016 new year, and to the latest impact of the Brexit vote. Versus the resiliency of the U.S. market, the past year in international markets was disappointing at a negative 12.7%, with a year-to-date return at June 30 for the EAFE Index of -6.3%. A continued rally since the end of the second quarter has cut the year-to-date loss to -3.9%, although effects from weaker foreign currencies continue to drag on a full price recovery.

Lake Jericho’s long-term portfolio construction process involves five distinct levels of strategic decision making. The first level in our process is the global allocation decision; how much of a portfolio should be invested in international markets versus invested in the U.S. market. Our long-term outlook for growth rates in international markets exceed that of our long-term outlook for U.S. growth. The higher growth expectation is why we invest significant assets in international markets. While our allocations are less than a global market-neutral allocation, they are higher than the typical U.S. based investment advisor. No doubt that the past year has been challenging as a result. However, bad times, as with good, don’t last forever. As the table below illustrates, one year’s laggard is often among the next year’s leaders. Mean-reversion is real and is why we remain committed to our total international allocation level within portfolios. These global investment decisions then inform asset allocation decisions amongst stocks, bonds, and alternative asset classes within U.S. or international markets (the second level of the strategic decision making process). If we make any changes during the second half of 2016, it would be to reallocate the geographic distribution of the international holdings rather than any reduction of the total international allocation.
 Source: NovelInvestor.com
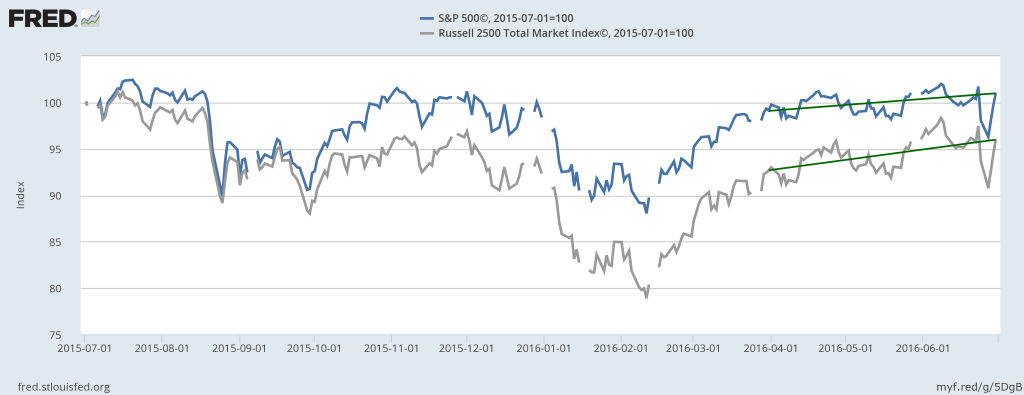
The S&P 500 Index returned 2.5% for the 2nd quarter, resulting in a year-to-date return through June 30 of 3.8%. Small- and mid-sized company stocks (represented by the Russell 2500 Index) fared even better with quarterly gains of 3.6% (for a year-to-date through June 30 return of 4.0%). Certainly, being invested in U.S. equities (particularly in large U.S. companies) has been most advantageous during the past year. The chart below compares the S&P 500 Index and the Russell 2500 for the past year. I draw your attention to two things; the outperformance of large companies versus smaller companies through the early months of 2016, and then to the reversal of that performance difference between during the last four months. You will see (by the slope of the two green lines) that during the second quarter small- and mid-sized companies narrowed that performance gap. These “size” decisions are another among the five levels of our portfolio construction process. Investment performance during the quarter was helped by our typical overweighting of small- and mid-sized companies versus a U.S. equity market-neutral portfolio.

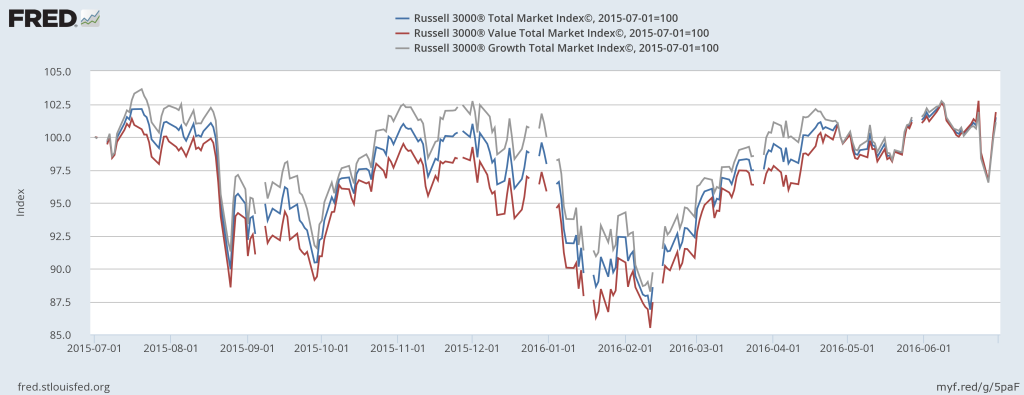
Company valuation metrics are another distinct level of our long-term decision making process. Company valuation categorization is a combination of quantitative measurements and qualitative art, referring to companies as value-oriented, growth-oriented, or core. In layperson’s terms, it boils down to “how expensive is the stock versus its earnings expectations”. Although Lake Jericho portfolios most often represent elements of each category, our long-term bias tilts towards value-oriented investments. Some refer to our style as “growth at a reasonable price”, a fair label as far as labels go. When examining the next chart one will see that value-oriented investment strategies (the red line) have underperformed both growth-oriented (the silver line) and core investments (the blue line) during 2015 and early 2016. This pattern reversed late during the first quarter and value strategies outperformed through the second quarter. Value-oriented strategies, which we do overweight versus a global market-neutral portfolio, now slightly lead both growth- and core-oriented strategies for the last year and have contributed positively to portfolio performance.

Bonds prices increased as interest rates fell for another quarter (interest rates and bond prices move in opposite directions). Over the last three months the Barclays Aggregate Bond Index (a broad measure of bond-market performance) was up 2.3%, 5.1% year-to-date, and is up 5.40% for the last year through June 30. We have maintained a more conservative position for clients than that represented by the Aggregate Index. Our bond positions remain invested at about a 2.7 year duration versus the Aggregate Index duration of about 5.5 years duration. The best way to think about duration and how it represents risk to bond investment performance is that should interest rates rise, a 2.7 year duration investment will be negatively affected by less than half of what the 5.5-year duration investment would be affected. The lower duration investments will not fall in price as dramatically as a longer duration investment when interest rates increase. With interest rates at historical lows, we feel that there is much more risk of interest rates rising in the U.S. than of rates continuing to fall. However, when interest rates fall the price of a short duration investment will not rise as dramatically as a longer duration investment. That is the trade off, and that is why our holdings returned about 1.5% for the 2nd quarter, 3.2% for the year-to-date, and about 3.8% for the year ending June 30.
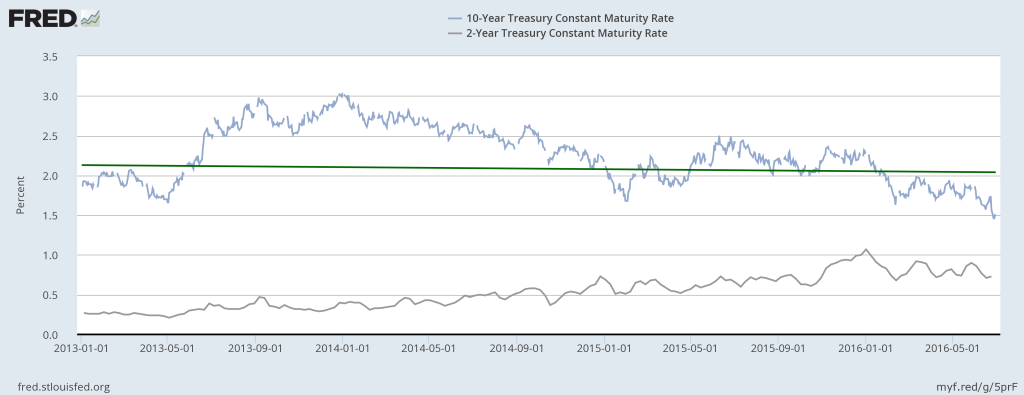
By sending interest rates lower, the bond market could be anticipating economic weakness or simply conceding that the U.S. Federal Reserve will be challenged to increase rates in the face of rising global uncertainty, regardless of the state of the U.S. economy. Either way, ever lower bond yields bolster a continuing argument that increasing stock prices are now the result of a lack of viable return alternatives to stocks, known as TINA (“There Is No Alternative”). The TINA argument acknowledges that the S&P 500 Index dividend yield has hovered around 2% for about 10 years while the yields on U.S. Treasury notes have steadily declined. The chart below illustrates the movement in U.S. Treasury bonds over time versus the rather steady nature (green line) of average stock dividend yields. Many large U.S. company stocks now provide dividend yields in excess of the yield on their own 10-year corporate bonds, and certainly above 10-year Treasury bond yields. Granted, the principal risk is higher for stocks, but the trade-off is perceived as manageable for long-term investors. For these reasons, it is easy to understand why some argue that stock prices are being pushed higher simply by those seeking a steady income stream jumping into stocks from bonds. Bonds, with prices that move inversely to interest rates, have been moving ever higher as well and now look incredibly expensive by comparison to stocks. At Lake Jericho, our view is a bit more tempered. We believe both the lofty stock and bond prices in the U.S. are more of a function of the “flight to quality” that investors undertake during times of heightened uncertainty and less to do with stretching for yield. Patience, ever our watchword, reminds us that normalcy always returns. As such, we feel that we are best positioned by maintaining modest bond exposures in our client portfolios and that those modest exposures themselves are quite conservatively invested. If (or when) interest rates do turn higher, we are well positioned.

Finally, tactical sector weighting is a fundamental element (the fifth level of decision making) of what we do and how we add value over time. Few portfolios will match all sector allocations, or sector allocation percentages exactly, or the timing of investments perfectly, and these factors certainly impact exact contribution to performance of our sector “bets”. However, our process of underweighting U.S. equity market-neutral benchmark allocations in favor of overweighting higher expected growth sectors (materials, medical devices and instruments, and pharmaceuticals) added about 0.40% in excess return to the typical client portfolio during the second quarter. Two sectors plays that have not performed as expected are our overweights to the consumer discretionary sector and our overweights in certain large and less risk-adverse portfolios to the genomics/biotechnology sector. While the consumer space has remained strong during this year’s volatility, that strength has not translated well into an increase in broad discretionary spending. While there are some signs of life beginning to emerge, discretionary spending has expanded much slower than we anticipated heading into 2016. The genomics/biotechnology sector has been hamstrung to a great extent by political rhetoric in the primary cycle. In fairness, there has been some concern about the pipelines for approval of new therapies but that shadow is beginning to fade and there now seems to be more merger and acquisition discussion in the space. We remain confident of a turn-around in the coming year. These two sectors served to reduce performance by about 0.20% during the second quarter.
So what does all of this mean for us going into the second half of 2016? More than 100 years ago American Financier and Banker J.P. Morgan said “No problem can be solved until it is reduced to some simple form. The changing of a vague difficulty into a specific, concrete form is a very essential element in thinking.” I think J.P. Morgan himself would agree that the essential element we need examine is global political stability and economic growth. I fear J.P. Morgan himself would agree that we have a deeper difficulty at the moment in our ability to examine global growth appropriately as we are faced with a unique challenge presently; increased ease and efficiency at doing the quantitative analysis required of us, but increased complexity and difficulty in the qualitative elements that influence our results. We have before us the statistical evidence supporting a forecast for broad expansion in the U.S. and international markets. We also have before us a great deal of political and social uncertainty, that which is impossible to quantify, that can undo all of the hard evidence and leave us flat for an extended period of time. Lake Jericho’s process is designed to capitalize most upon this latter prospect. While we fully expect to capture a great percentage of upside in rising markets, we are most adept at limiting downside risks during volatile times and through our tactical sector strategies capture value where ever it presents itself when opportunities are scarce. We are going to stay the course at least through the end of the third quarter. At that time we will re-evaluate the quantitative evidence before us and temper our outlook with the atmosphere (qualitative) that develops in advance of the U.S. elections. And of course, we will be continuously watching movements in the U.K., the E.U., and developments in Asia and the impacts upon client portfolios.
We are available at any time, any day of the week, to discuss specific portfolio and performance questions. Until then, be well and enjoy the rest of your weekend!
A.J. Walker CFP® CIMA®
Founder and Senior Consultant
Lake Jericho, LLC


